Travelers 2015 Annual Report Download - page 95
Download and view the complete annual report
Please find page 95 of the 2015 Travelers annual report below. You can navigate through the pages in the report by either clicking on the pages listed below, or by using the keyword search tool below to find specific information within the annual report.-
 1
1 -
2
-
3
-
4
-
5
-
6
-
7
-
8
-
9
-
10
-
11
-
12
-
13
-
14
-
15
-
16
-
17
-
18
-
19
-
20
-
21
-
22
-
23
-
24
-
25
-
26
-
27
-
28
-
29
-
30
-
31
-
32
-
33
-
34
-
35
-
36
-
37
-
38
-
39
-
40
-
41
-
42
-
43
-
44
-
45
-
46
-
47
-
48
-
49
-
50
-
51
-
52
-
53
-
54
-
55
-
56
-
57
-
58
-
59
-
60
-
61
-
62
-
63
-
64
-
65
-
66
-
67
-
68
-
69
-
70
-
71
-
72
-
73
-
74
-
75
-
76
-
77
-
78
-
79
-
80
-
81
-
82
-
83
-
84
-
 85
85 -
 86
86 -
 87
87 -
 88
88 -
 89
89 -
 90
90 -
 91
91 -
 92
92 -
 93
93 -
 94
94 -
 95
95 -
 96
96 -
 97
97 -
 98
98 -
 99
99 -
 100
100 -
 101
101 -
 102
102 -
 103
103 -
 104
104 -
 105
105 -
106
-
107
-
108
-
109
-
110
-
111
-
112
-
113
-
114
-
115
-
116
-
117
-
118
-
119
-
120
-
121
-
122
-
123
-
124
-
125
-
126
-
127
-
128
-
129
-
130
-
131
-
132
-
133
-
134
-
135
-
136
-
137
-
138
-
139
-
140
-
141
-
142
-
143
-
144
-
145
-
146
-
147
-
148
-
149
-
150
-
151
-
152
-
153
-
154
-
155
-
156
-
157
-
158
-
159
-
160
-
161
-
162
-
163
-
164
-
165
-
166
-
167
-
168
-
169
-
170
-
171
-
172
-
173
-
174
-
175
-
176
-
177
-
178
-
179
-
180
-
181
-
182
-
183
-
184
-
185
-
186
-
187
-
188
-
189
-
190
-
191
-
192
-
193
-
194
-
195
-
196
-
197
-
198
-
199
-
200
-
201
-
202
-
203
-
204
-
205
-
206
-
207
-
208
-
209
-
210
-
211
-
212
-
213
-
214
-
215
-
216
-
217
-
218
-
219
-
220
-
221
-
222
-
223
-
224
-
225
-
226
-
227
-
228
-
229
-
230
-
231
-
232
-
233
-
234
-
235
-
236
-
237
-
238
-
239
-
240
-
241
-
242
-
243
-
244
-
245
-
246
-
247
-
248
-
249
-
250
-
251
-
252
-
253
-
254
-
255
-
256
-
257
-
258
-
259
-
260
-
261
-
262
-
263
-
264
-
265
-
266
-
267
-
268
-
269
-
270
-
271
-
272
-
273
-
274
-
275
-
276
-
277
-
278
-
279
-
280
-
281
-
282
-
283
-
284
-
285
-
286
-
287
 |
 |
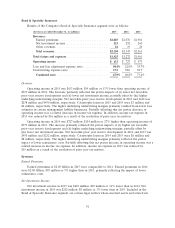
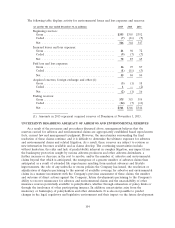
Net Investment Income
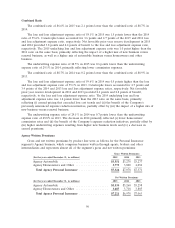
Net investment income in 2015 was $332 million, $47 million or 12% lower than in 2014. Net
investment income in 2014 was $379 million, $10 million or 3% higher than in 2013. Refer to the ‘‘Net
Investment Income’’ section of ‘‘Consolidated Results of Operations’’ herein for a discussion of the
changes in the Company’s net investment income in 2015 and 2014 as compared with the respective
prior year. In addition, refer to note 2 of notes to the consolidated financial statements herein for a
discussion of the Company’s net investment income allocation methodology.
Other Revenues
Other revenues in all years presented included installment premium charges. Other revenues in
2014 and 2013 also included revenues associated with the runoff of the Company’s National Flood
Insurance Program (NFIP) business that was sold on a renewal rights basis in 2013. Other revenues in
2013 also included a $20 million gain from the sale of those NFIP renewal rights. The Company was a
participant in the NFIP Write Your Own Program administered by the Federal Emergency
Management Agency (FEMA) and the Federal Insurance & Mitigation Administration.
Claims and Expenses
Claims and Claim Adjustment Expenses
Claims and claim adjustment expenses of $4.22 billion in 2015 were comparable to 2014, primarily
reflecting (i) higher net favorable prior year reserve development and (ii) lower catastrophe losses,
largely offset by (iii) the impact of loss cost trends and (iv) higher volumes of insured exposures.
Claims and claim adjustment expenses in 2014 were $4.24 billion, $83 million or 2% lower than in
2013, primarily reflecting (i) the impact of lower volumes of insured exposures and (ii) the benefit of
the Company’s previously announced expense reduction initiatives on claim adjustment expenses,
partially offset by (iii) higher catastrophe losses, (iv) the impact of loss cost trends and (v) lower net
favorable prior year reserve development. Factors contributing to net favorable prior year reserve
development during the years ended December 31, 2015, 2014 and 2013 are discussed in more detail in
note 7 of notes to the consolidated financial statements.
Amortization of Deferred Acquisition Costs
Amortization of deferred acquisition costs in 2015 was $1.16 billion, $10 million or 1% lower than
in 2014. Amortization of deferred acquisition costs in 2014 was $1.17 billion, $112 million or 9% lower
than in 2013. The decrease in 2014 primarily reflected a decline in commission expense due to lower
commission rates, as well as a decline in earned premiums compared with 2013.
General and Administrative Expenses
General and administrative expenses of $973 million in 2015 and $977 million in 2014 were
comparable to the respective prior year amounts.
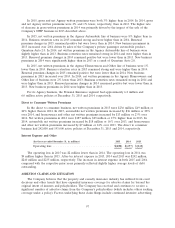
Income Tax Expense
Income tax expense in 2015 was $402 million, $36 million or 10% higher than in 2014, primarily
reflecting the $101 million increase in income before income taxes, partially offset by the $4 million
reduction in income tax expense resulting from the resolution of prior year tax matters in 2015. Income
tax expense of $366 million in 2014 was comparable to 2013, as the tax effect of the $14 million
decrease in income before income taxes was offset by the impact of a $5 million reduction in income
tax expense in 2013 resulting from the resolution of prior year tax matters.
95