Travelers 2015 Annual Report Download - page 80
Download and view the complete annual report
Please find page 80 of the 2015 Travelers annual report below. You can navigate through the pages in the report by either clicking on the pages listed below, or by using the keyword search tool below to find specific information within the annual report.-
 1
1 -
2
-
3
-
4
-
5
-
6
-
7
-
8
-
9
-
10
-
11
-
12
-
13
-
14
-
15
-
16
-
17
-
18
-
19
-
20
-
21
-
22
-
23
-
24
-
25
-
26
-
27
-
28
-
29
-
30
-
31
-
32
-
33
-
34
-
35
-
36
-
37
-
38
-
39
-
40
-
41
-
42
-
43
-
44
-
45
-
46
-
47
-
48
-
49
-
50
-
51
-
52
-
53
-
54
-
55
-
56
-
57
-
58
-
59
-
60
-
61
-
62
-
63
-
64
-
65
-
66
-
67
-
68
-
69
-
 70
70 -
 71
71 -
 72
72 -
 73
73 -
 74
74 -
 75
75 -
 76
76 -
 77
77 -
 78
78 -
 79
79 -
 80
80 -
 81
81 -
 82
82 -
 83
83 -
 84
84 -
 85
85 -
 86
86 -
 87
87 -
 88
88 -
 89
89 -
 90
90 -
91
-
92
-
93
-
94
-
95
-
96
-
97
-
98
-
99
-
100
-
101
-
102
-
103
-
104
-
105
-
106
-
107
-
108
-
109
-
110
-
111
-
112
-
113
-
114
-
115
-
116
-
117
-
118
-
119
-
120
-
121
-
122
-
123
-
124
-
125
-
126
-
127
-
128
-
129
-
130
-
131
-
132
-
133
-
134
-
135
-
136
-
137
-
138
-
139
-
140
-
141
-
142
-
143
-
144
-
145
-
146
-
147
-
148
-
149
-
150
-
151
-
152
-
153
-
154
-
155
-
156
-
157
-
158
-
159
-
160
-
161
-
162
-
163
-
164
-
165
-
166
-
167
-
168
-
169
-
170
-
171
-
172
-
173
-
174
-
175
-
176
-
177
-
178
-
179
-
180
-
181
-
182
-
183
-
184
-
185
-
186
-
187
-
188
-
189
-
190
-
191
-
192
-
193
-
194
-
195
-
196
-
197
-
198
-
199
-
200
-
201
-
202
-
203
-
204
-
205
-
206
-
207
-
208
-
209
-
210
-
211
-
212
-
213
-
214
-
215
-
216
-
217
-
218
-
219
-
220
-
221
-
222
-
223
-
224
-
225
-
226
-
227
-
228
-
229
-
230
-
231
-
232
-
233
-
234
-
235
-
236
-
237
-
238
-
239
-
240
-
241
-
242
-
243
-
244
-
245
-
246
-
247
-
248
-
249
-
250
-
251
-
252
-
253
-
254
-
255
-
256
-
257
-
258
-
259
-
260
-
261
-
262
-
263
-
264
-
265
-
266
-
267
-
268
-
269
-
270
-
271
-
272
-
273
-
274
-
275
-
276
-
277
-
278
-
279
-
280
-
281
-
282
-
283
-
284
-
285
-
286
-
287
 |
 |
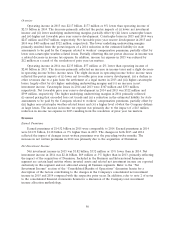
related decrease in income tax expense. In addition, income tax expense in 2015 was reduced by
$32 million as a result of the resolution of prior year tax matters.
Diluted net income per share of $10.70 in 2014 increased by 10% over diluted net income per
share of $9.74 in 2013. Net income of $3.69 billion in 2014 increased slightly over net income of
$3.67 billion in 2013. The higher percentage increase in diluted net income per share reflected the
impact of share repurchases in recent periods. The slight increase in net income primarily reflected the
pretax impacts of (i) higher underlying underwriting margins, (ii) higher net favorable prior year
reserve development and (iii) higher net investment income, partially offset by (iv) higher catastrophe
losses, (v) a decline in other revenues due to a gain from the settlement of a legal matter in 2013 and
(vi) lower net realized investment gains. Catastrophe losses in 2014 and 2013 were $709 million and
$591 million, respectively. Net favorable prior year reserve development in 2014 and 2013 was
$941 million and $840 million, respectively. The higher underlying underwriting margins primarily
resulted from the impacts of (i) earned pricing that exceeded loss cost trends in each of the Company’s
business segments, (ii) lower reinsurance costs and (iii) a 2014 reduction in the estimated liability for
state assessments to be paid by the Company related to workers’ compensation premiums, partially
offset by (iv) an increase in non-catastrophe weather-related losses and (v) a higher level of what the
Company defines as large losses. Partially offsetting this net pretax increase in income was a related
increase in income tax expense. In addition, income tax expense in 2013 was reduced by $63 million as
a result of the resolution of prior year tax matters.
The Company has insurance operations in Canada, the United Kingdom and the Republic of
Ireland, as well as in Brazil, primarily through a joint venture. Because these operations are conducted
in local currencies other than the U.S. dollar, the Company is subject to changes in foreign currency
exchange rates. For the years ended December 31, 2015, 2014 and 2013, changes in foreign currency
exchange rates had the impact of lowering the reported line items in the statement of income by
insignificant amounts. The impact of these changes was not material to the Company’s net income or
the Business and International Insurance segment’s operating income for the years reported.
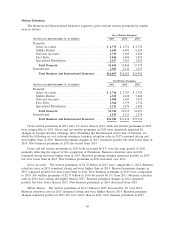
Revenues
Earned Premiums
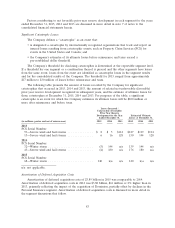
Earned premiums in 2015 were $23.87 billion, $161 million or 1% higher than in 2014. In the
Business and International Insurance and the Bond & Specialty Insurance segments, earned premiums
in 2015 were comparable to 2014. In the Personal Insurance segment, earned premiums in 2015
increased by 2% over 2014.
Earned premiums in 2014 were $23.71 billion, $1.08 billion or 5% higher than in 2013. In the
Business and International Insurance segment, earned premiums in 2014 increased by 9% over 2013,
primarily reflecting the impact of the acquisition of Dominion in November 2013. In the Bond &
Specialty Insurance segment, earned premiums in 2014 increased by 5% over 2013. In the Personal
Insurance segment, earned premiums in 2014 decreased by 3% from 2013.
Factors contributing to the changes in earned premiums in each segment in 2015 and 2014
compared with the respective prior year are discussed in more detail in the segment discussions that
follow.
80