Travelers 2015 Annual Report Download - page 86
Download and view the complete annual report
Please find page 86 of the 2015 Travelers annual report below. You can navigate through the pages in the report by either clicking on the pages listed below, or by using the keyword search tool below to find specific information within the annual report.-
 1
1 -
2
-
3
-
4
-
5
-
6
-
7
-
8
-
9
-
10
-
11
-
12
-
13
-
14
-
15
-
16
-
17
-
18
-
19
-
20
-
21
-
22
-
23
-
24
-
25
-
26
-
27
-
28
-
29
-
30
-
31
-
32
-
33
-
34
-
35
-
36
-
37
-
38
-
39
-
40
-
41
-
42
-
43
-
44
-
45
-
46
-
47
-
48
-
49
-
50
-
51
-
52
-
53
-
54
-
55
-
56
-
57
-
58
-
59
-
60
-
61
-
62
-
63
-
64
-
65
-
66
-
67
-
68
-
69
-
70
-
71
-
72
-
73
-
74
-
75
-
 76
76 -
 77
77 -
 78
78 -
 79
79 -
 80
80 -
 81
81 -
 82
82 -
 83
83 -
 84
84 -
 85
85 -
 86
86 -
 87
87 -
 88
88 -
 89
89 -
 90
90 -
 91
91 -
 92
92 -
 93
93 -
 94
94 -
 95
95 -
 96
96 -
97
-
98
-
99
-
100
-
101
-
102
-
103
-
104
-
105
-
106
-
107
-
108
-
109
-
110
-
111
-
112
-
113
-
114
-
115
-
116
-
117
-
118
-
119
-
120
-
121
-
122
-
123
-
124
-
125
-
126
-
127
-
128
-
129
-
130
-
131
-
132
-
133
-
134
-
135
-
136
-
137
-
138
-
139
-
140
-
141
-
142
-
143
-
144
-
145
-
146
-
147
-
148
-
149
-
150
-
151
-
152
-
153
-
154
-
155
-
156
-
157
-
158
-
159
-
160
-
161
-
162
-
163
-
164
-
165
-
166
-
167
-
168
-
169
-
170
-
171
-
172
-
173
-
174
-
175
-
176
-
177
-
178
-
179
-
180
-
181
-
182
-
183
-
184
-
185
-
186
-
187
-
188
-
189
-
190
-
191
-
192
-
193
-
194
-
195
-
196
-
197
-
198
-
199
-
200
-
201
-
202
-
203
-
204
-
205
-
206
-
207
-
208
-
209
-
210
-
211
-
212
-
213
-
214
-
215
-
216
-
217
-
218
-
219
-
220
-
221
-
222
-
223
-
224
-
225
-
226
-
227
-
228
-
229
-
230
-
231
-
232
-
233
-
234
-
235
-
236
-
237
-
238
-
239
-
240
-
241
-
242
-
243
-
244
-
245
-
246
-
247
-
248
-
249
-
250
-
251
-
252
-
253
-
254
-
255
-
256
-
257
-
258
-
259
-
260
-
261
-
262
-
263
-
264
-
265
-
266
-
267
-
268
-
269
-
270
-
271
-
272
-
273
-
274
-
275
-
276
-
277
-
278
-
279
-
280
-
281
-
282
-
283
-
284
-
285
-
286
-
287
 |
 |
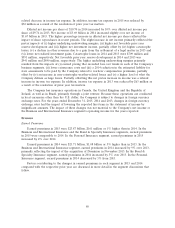
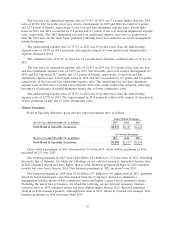
Overview
Operating income in 2015 was $2.17 billion, $177 million or 8% lower than operating income of
$2.35 billion in 2014. The decrease primarily reflected the pretax impacts of (i) lower net investment
income and (ii) lower underlying underwriting margins, partially offset by (iii) lower catastrophe losses
and (iv) higher net favorable prior year reserve development. Catastrophe losses in 2015 and 2014 were
$247 million and $367 million, respectively. Net favorable prior year reserve development in 2015 and
2014 was $405 million and $322 million, respectively. The lower underlying underwriting margins
primarily resulted from the pretax impacts of a 2014 reduction in the estimated liability for state
assessments to be paid by the Company related to workers’ compensation premiums, partially offset by
lower non-catastrophe weather-related losses. Partially offsetting this net pretax decrease in income was
a related decrease in income tax expense. In addition, income tax expense in 2015 was reduced by
$12 million as a result of the resolution of prior year tax matters.
Operating income in 2014 was $2.35 billion, $57 million or 2% lower than operating income of
$2.40 billion in 2013. The decrease primarily reflected an increase in income taxes and a slight decrease
in operating income before income taxes. The slight decrease in operating income before income taxes
reflected the pretax impacts of (i) lower net favorable prior year reserve development, (ii) a decline in
other revenues due to a gain from the settlement of a legal matter in 2013 and (iii) higher catastrophe
losses, largely offset by (iv) higher underlying underwriting margins and (v) an increase in net
investment income. Catastrophe losses in 2014 and 2013 were $367 million and $333 million,
respectively. Net favorable prior year reserve development in 2014 and 2013 was $322 million and
$399 million, respectively. The higher underlying underwriting margins in 2014 primarily reflected
(i) earned pricing that exceeded loss cost trends and (ii) a reduction in the estimated liability for state
assessments to be paid by the Company related to workers’ compensation premiums, partially offset by
(iii) higher non-catastrophe weather-related losses and (iv) a higher level of what the Company defines
as large losses. The increase in income tax expense was primarily due to the impact of a $43 million
reduction in income tax expense in 2013 resulting from the resolution of prior year tax matters.
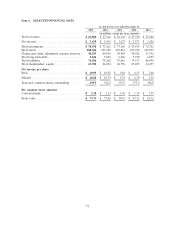
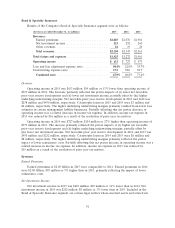
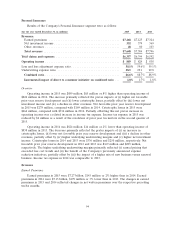
Revenues
Earned Premiums
Earned premiums of $14.52 billion in 2015 were comparable to 2014. Earned premiums in 2014
were $14.51 billion, $1.18 billion or 9% higher than in 2013. The changes in both 2015 and 2014
reflected the impact of changes in net written premiums over the preceding twelve months. The
increase in net written premiums in 2014 was primarily due to the acquisition of Dominion.
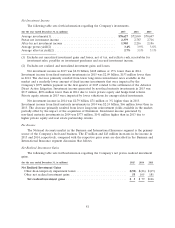
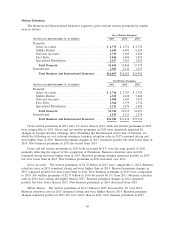
Net Investment Income
Net investment income in 2015 was $1.82 billion, $332 million or 15% lower than in 2014. Net
investment income in 2014 was $2.16 billion, $69 million or 3% higher than in 2013, primarily reflecting
the impact of the acquisition of Dominion. Included in the Business and International Insurance
segment are certain legal entities whose invested assets and related net investment income are reported
exclusively in this segment and not allocated among all business segments. Refer to the ‘‘Net
Investment Income’’ section of the ‘‘Consolidated Results of Operations’’ discussion herein for a
description of the factors contributing to the changes in the Company’s consolidated net investment
income in 2015 and 2014 compared with the respective prior years. In addition, refer to note 2 of notes
to the consolidated financial statements herein for a discussion of the Company’s net investment
income allocation methodology.
86