Travelers 2015 Annual Report Download - page 107
Download and view the complete annual report
Please find page 107 of the 2015 Travelers annual report below. You can navigate through the pages in the report by either clicking on the pages listed below, or by using the keyword search tool below to find specific information within the annual report.-
 1
1 -
2
-
3
-
4
-
5
-
6
-
7
-
8
-
9
-
10
-
11
-
12
-
13
-
14
-
15
-
16
-
17
-
18
-
19
-
20
-
21
-
22
-
23
-
24
-
25
-
26
-
27
-
28
-
29
-
30
-
31
-
32
-
33
-
34
-
35
-
36
-
37
-
38
-
39
-
40
-
41
-
42
-
43
-
44
-
45
-
46
-
47
-
48
-
49
-
50
-
51
-
52
-
53
-
54
-
55
-
56
-
57
-
58
-
59
-
60
-
61
-
62
-
63
-
64
-
65
-
66
-
67
-
68
-
69
-
70
-
71
-
72
-
73
-
74
-
75
-
76
-
77
-
78
-
79
-
80
-
81
-
82
-
83
-
84
-
85
-
86
-
87
-
88
-
89
-
90
-
91
-
92
-
93
-
94
-
95
-
96
-
 97
97 -
 98
98 -
 99
99 -
 100
100 -
 101
101 -
 102
102 -
 103
103 -
 104
104 -
 105
105 -
 106
106 -
 107
107 -
 108
108 -
 109
109 -
 110
110 -
 111
111 -
 112
112 -
 113
113 -
 114
114 -
 115
115 -
 116
116 -
 117
117 -
118
-
119
-
120
-
121
-
122
-
123
-
124
-
125
-
126
-
127
-
128
-
129
-
130
-
131
-
132
-
133
-
134
-
135
-
136
-
137
-
138
-
139
-
140
-
141
-
142
-
143
-
144
-
145
-
146
-
147
-
148
-
149
-
150
-
151
-
152
-
153
-
154
-
155
-
156
-
157
-
158
-
159
-
160
-
161
-
162
-
163
-
164
-
165
-
166
-
167
-
168
-
169
-
170
-
171
-
172
-
173
-
174
-
175
-
176
-
177
-
178
-
179
-
180
-
181
-
182
-
183
-
184
-
185
-
186
-
187
-
188
-
189
-
190
-
191
-
192
-
193
-
194
-
195
-
196
-
197
-
198
-
199
-
200
-
201
-
202
-
203
-
204
-
205
-
206
-
207
-
208
-
209
-
210
-
211
-
212
-
213
-
214
-
215
-
216
-
217
-
218
-
219
-
220
-
221
-
222
-
223
-
224
-
225
-
226
-
227
-
228
-
229
-
230
-
231
-
232
-
233
-
234
-
235
-
236
-
237
-
238
-
239
-
240
-
241
-
242
-
243
-
244
-
245
-
246
-
247
-
248
-
249
-
250
-
251
-
252
-
253
-
254
-
255
-
256
-
257
-
258
-
259
-
260
-
261
-
262
-
263
-
264
-
265
-
266
-
267
-
268
-
269
-
270
-
271
-
272
-
273
-
274
-
275
-
276
-
277
-
278
-
279
-
280
-
281
-
282
-
283
-
284
-
285
-
286
-
287
 |
 |

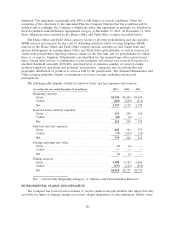
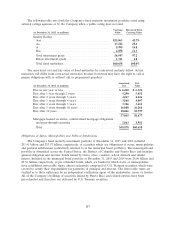
The following table sets forth the Company’s fixed maturity investment portfolio rated using
external ratings agencies or by the Company when a public rating does not exist:
Carrying Percent of Total
(at December 31, 2015, in millions) Value Carrying Value
Quality Rating:
Aaa ....................................... $25,865 42.7%
Aa ........................................ 17,226 28.4
A......................................... 8,998 14.8
Baa ....................................... 6,858 11.3
Total investment grade .......................... 58,947 97.2
Below investment grade ......................... 1,711 2.8
Total fixed maturities ........................... $60,658 100.0%
The amortized cost and fair value of fixed maturities by contractual maturity follow. Actual
maturities will differ from contractual maturities because borrowers may have the right to call or
prepay obligations with or without call or prepayment penalties.
Amortized Fair
(at December 31, 2015, in millions) Cost Value
Due in one year or less .............................. $ 6,240 $ 6,324
Due after 1 year through 2 years ....................... 5,290 5,452
Due after 2 years through 3 years ...................... 4,267 4,426
Due after 3 years through 4 years ...................... 3,868 4,007
Due after 4 years through 5 years ...................... 3,316 3,411
Due after 5 years through 10 years ...................... 16,008 16,260
Due after 10 years .................................. 18,026 18,797
57,015 58,677
Mortgage-backed securities, collateralized mortgage obligations
and pass-through securities .......................... 1,863 1,981
Total .......................................... $58,878 $60,658
Obligations of States, Municipalities and Political Subdivisions
The Company’s fixed maturity investment portfolio at December 31, 2015 and 2014 included
$31.41 billion and $33.57 billion, respectively, of securities which are obligations of states, municipalities
and political subdivisions (collectively referred to as the municipal bond portfolio). The municipal bond
portfolio is diversified across the United States, the District of Columbia and Puerto Rico and includes
general obligation and revenue bonds issued by states, cities, counties, school districts and similar
issuers. Included in the municipal bond portfolio at December 31, 2015 and 2014 were $6.06 billion and
$7.56 billion, respectively, of pre-refunded bonds, which are bonds for which states or municipalities
have established irrevocable trusts, almost exclusively comprised of U.S. Treasury securities, which were
created to satisfy their responsibility for payments of principal and interest. The irrevocable trusts are
verified as to their sufficiency by an independent verification agent of the underwriter, issuer or trustee.
All of the Company’s holdings of securities issued by Puerto Rico and related entities have been
pre-refunded and therefore are defeased by U.S. Treasury securities.
107