Travelers 2015 Annual Report Download - page 92
Download and view the complete annual report
Please find page 92 of the 2015 Travelers annual report below. You can navigate through the pages in the report by either clicking on the pages listed below, or by using the keyword search tool below to find specific information within the annual report.-
 1
1 -
2
-
3
-
4
-
5
-
6
-
7
-
8
-
9
-
10
-
11
-
12
-
13
-
14
-
15
-
16
-
17
-
18
-
19
-
20
-
21
-
22
-
23
-
24
-
25
-
26
-
27
-
28
-
29
-
30
-
31
-
32
-
33
-
34
-
35
-
36
-
37
-
38
-
39
-
40
-
41
-
42
-
43
-
44
-
45
-
46
-
47
-
48
-
49
-
50
-
51
-
52
-
53
-
54
-
55
-
56
-
57
-
58
-
59
-
60
-
61
-
62
-
63
-
64
-
65
-
66
-
67
-
68
-
69
-
70
-
71
-
72
-
73
-
74
-
75
-
76
-
77
-
78
-
79
-
80
-
81
-
 82
82 -
 83
83 -
 84
84 -
 85
85 -
 86
86 -
 87
87 -
 88
88 -
 89
89 -
 90
90 -
 91
91 -
 92
92 -
 93
93 -
 94
94 -
 95
95 -
 96
96 -
 97
97 -
 98
98 -
 99
99 -
 100
100 -
 101
101 -
 102
102 -
103
-
104
-
105
-
106
-
107
-
108
-
109
-
110
-
111
-
112
-
113
-
114
-
115
-
116
-
117
-
118
-
119
-
120
-
121
-
122
-
123
-
124
-
125
-
126
-
127
-
128
-
129
-
130
-
131
-
132
-
133
-
134
-
135
-
136
-
137
-
138
-
139
-
140
-
141
-
142
-
143
-
144
-
145
-
146
-
147
-
148
-
149
-
150
-
151
-
152
-
153
-
154
-
155
-
156
-
157
-
158
-
159
-
160
-
161
-
162
-
163
-
164
-
165
-
166
-
167
-
168
-
169
-
170
-
171
-
172
-
173
-
174
-
175
-
176
-
177
-
178
-
179
-
180
-
181
-
182
-
183
-
184
-
185
-
186
-
187
-
188
-
189
-
190
-
191
-
192
-
193
-
194
-
195
-
196
-
197
-
198
-
199
-
200
-
201
-
202
-
203
-
204
-
205
-
206
-
207
-
208
-
209
-
210
-
211
-
212
-
213
-
214
-
215
-
216
-
217
-
218
-
219
-
220
-
221
-
222
-
223
-
224
-
225
-
226
-
227
-
228
-
229
-
230
-
231
-
232
-
233
-
234
-
235
-
236
-
237
-
238
-
239
-
240
-
241
-
242
-
243
-
244
-
245
-
246
-
247
-
248
-
249
-
250
-
251
-
252
-
253
-
254
-
255
-
256
-
257
-
258
-
259
-
260
-
261
-
262
-
263
-
264
-
265
-
266
-
267
-
268
-
269
-
270
-
271
-
272
-
273
-
274
-
275
-
276
-
277
-
278
-
279
-
280
-
281
-
282
-
283
-
284
-
285
-
286
-
287
 |
 |
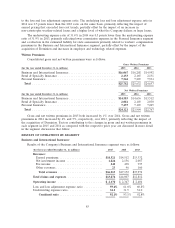
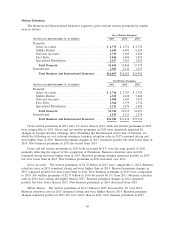
investment income are reported exclusively in this segment and not allocated among all business
segments. As a result, reported net investment income in the Bond & Specialty Insurance segment
reflects a significantly smaller proportion of allocated net investment income, including that from the
Company’s non-fixed maturity investments that experienced a decrease in investment income in 2015
and an increase in investment income in 2014. Refer to the ‘‘Net Investment Income’’ section of the
‘‘Consolidated Results of Operations’’ discussion herein for a description of the factors contributing to
the changes in the Company’s consolidated net investment income in 2015 and 2014 compared with the
respective prior years. In addition, refer to note 2 of notes to the consolidated financial statements
herein for a discussion of the Company’s net investment income allocation methodology.
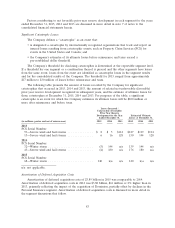
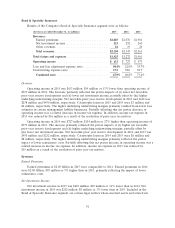
Claims and Expenses
Claims and Claim Adjustment Expenses
Claims and claim adjustment expenses in 2015 were $643 million, $162 million or 34% higher than
in 2014, primarily reflecting (i) lower net favorable prior year reserve development, partially offset by
(ii) lower loss estimates in certain management liability businesses. Claims and claim adjustment
expenses in 2014 were $481 million, $214 million or 31% lower than in 2013, primarily reflecting the
impact of higher net favorable prior year reserve development. Factors contributing to net favorable
prior year reserve development during the years ended December 31, 2015, 2014 and 2013 are
discussed in more detail in note 7 of notes to the consolidated financial statements herein.
Amortization of Deferred Acquisition Costs
Amortization of deferred acquisition costs in 2015 was $393 million, $5 million or 1% higher than
in 2014. Amortization of deferred acquisition costs in 2014 was $388 million, $10 million or 3% higher
than in 2013. The increases in both years were generally consistent with the changes in earned
premiums.
General and Administrative Expenses
General and administrative expenses in 2015 were $389 million, $14 million or 3% lower than in
2014, primarily reflecting the impact of certain customer-related intangible assets becoming fully
amortized during the second quarter of 2015. General and administrative expenses in 2014 were
$403 million, $15 million or 4% higher than in 2013, primarily reflecting the impact of higher employee
and technology related expenses.
Income Tax Expense
Income tax expense in 2015 was $272 million, $76 million or 22% lower than in 2014, primarily
reflecting the $170 million decrease in income before income taxes and the $16 million reduction in
income tax expense in 2015 resulting from the resolution of prior year tax matters. Income tax expense
in 2014 was $348 million, $121 million or 53% higher than in 2013, primarily reflecting the $275 million
increase in income before income taxes, as well as a $15 million reduction in income tax expenses in
2013 resulting from the resolution of prior year tax matters.
Combined Ratio
The combined ratio of 67.9% in 2015 was 7.1 points higher than the combined ratio of 60.8% in
2014.
92