Symantec 2013 Annual Report Download - page 86
Download and view the complete annual report
Please find page 86 of the 2013 Symantec annual report below. You can navigate through the pages in the report by either clicking on the pages listed below, or by using the keyword search tool below to find specific information within the annual report.-
 1
1 -
2
-
3
-
4
-
5
-
6
-
7
-
8
-
9
-
10
-
11
-
12
-
13
-
14
-
15
-
16
-
17
-
18
-
19
-
20
-
21
-
22
-
23
-
24
-
25
-
26
-
27
-
28
-
29
-
30
-
31
-
32
-
33
-
34
-
35
-
36
-
37
-
38
-
39
-
40
-
41
-
42
-
43
-
44
-
45
-
46
-
47
-
48
-
49
-
50
-
51
-
52
-
53
-
54
-
55
-
56
-
57
-
58
-
59
-
60
-
61
-
62
-
63
-
64
-
65
-
66
-
67
-
68
-
69
-
70
-
71
-
72
-
73
-
74
-
75
-
 76
76 -
 77
77 -
 78
78 -
 79
79 -
 80
80 -
 81
81 -
 82
82 -
 83
83 -
 84
84 -
 85
85 -
 86
86 -
 87
87 -
 88
88 -
 89
89 -
 90
90 -
 91
91 -
 92
92 -
 93
93 -
 94
94 -
 95
95 -
 96
96 -
97
-
98
-
99
-
100
-
101
-
102
-
103
-
104
-
105
-
106
-
107
-
108
-
109
-
110
-
111
-
112
-
113
-
114
-
115
-
116
-
117
-
118
-
119
-
120
-
121
-
122
-
123
-
124
-
125
-
126
-
127
-
128
-
129
-
130
-
131
-
132
-
133
-
134
-
135
-
136
-
137
-
138
-
139
-
140
-
141
-
142
-
143
-
144
-
145
-
146
-
147
-
148
-
149
-
150
-
151
-
152
-
153
-
154
-
155
-
156
-
157
-
158
-
159
-
160
-
161
-
162
-
163
-
164
-
165
-
166
-
167
-
168
-
169
-
170
-
171
-
172
-
173
-
174
-
175
-
176
-
177
-
178
-
179
-
180
-
181
-
182
-
183
-
184
-
185
-
186
-
187
-
188
-
189
-
190
-
191
-
192
-
193
-
194
-
195
-
196
-
197
-
198
-
199
-
200
-
201
-
202
-
203
-
204
 |
 |

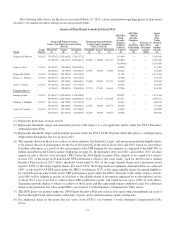
For a summary of the terms of the FY13 Executive Annual Incentive Plan, see “Compensation Discussion & Analysis (CD&A)
— Compensation Components — Executive Annual Incentive Plans” above. For a summary of the terms of the FY13 LTIP, see
“Compensation Discussion & Analysis (CD&A) — Compensation Components — Long Term Incentive Plans (LTIP)” above. Details
of acceleration of the equity awards described are disclosed under “Compensation Discussion & Analysis (CD&A) — Other Benefits
— Change in Control and Severance Arrangements” above and “Potential Payments Upon Termination or Change in Control” below.
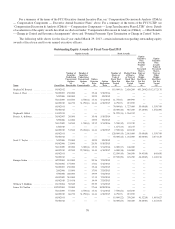
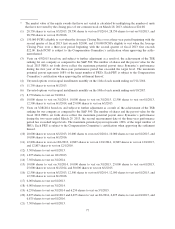
The following table shows for the fiscal year ended March 29, 2013, certain information regarding outstanding equity
awards at fiscal year end for our named executive officers.
Outstanding Equity Awards At Fiscal Year-End 2013
Option Awards Stock Awards
Name Grant Date
Number of
Securities
Underlying
Unexercised
Options
(#)
Exercisable
Number of
Securities
Underlying
Unexercised
Options
(#)
Unexercisable
Option
Exercise
Price
($)
Option
Expiration
Date
Number of
Shares or
Units of
Stock That
Have Not
Vested
(#)
Market Value
of Shares
or Units of
Stock That
Have Not
Vested
($)*
Equity
Incentive
Plan
Awards:
Number
of
Unearned
Shares,
Units or
Other
Rights
that Have
Not Yet
Vested
(#)
Equity
Incentive
Plan
Awards:
Value of
Unearned
Shares,
Units or
Other
Rights
that Have
Not Yet
Vested
($)*
Stephen M. Bennett ................. 9/10/2012 — — — — 115,000(1) 2,838,200 493,200(2)(3)12,172,176
James A. Beer ...................... 5/10/2007 150,000 — 19.48 5/10/2014 — — — —
5/9/2008 100,000 — 19.99 5/9/2015 — — — —
5/11/2009 103,500 4,500(4) 15.32 5/11/2016 11,750(5) 289,990 — —
6/10/2010 68,750 31,250(6) 14.44 6/10/2017 8,750(7) 215,950 — —
6/10/2011 — — — — 70,000(8) 1,727,600 55,096(9) 1,359,769
5/10/2012 — — — — 40,000(10) 987,200 67,200(3) 1,658,496
Stephen E. Gillett ................... 1/10/2013 — — — — 51,229(11) 1,264,332 — —
Francis A. deSouza .................. 5/10/2007 20,000 — 19.48 5/10/2014 — — — —
5/9/2008 61,000 — 19.99 5/9/2015 — — — —
5/11/2009 34,500 1,500(4) 15.32 5/11/2016 5,500(12) 135,740 — —
1/8/2010 — — — — 1,875(13) 46,275 — —
6/10/2010 51,562 23,438(6) 14.44 6/10/2017 7,500(14) 185,100 — —
6/10/2011 — — — — 120,000(15) 2,961,600 55,096(9) 1,359,769
5/10/2012 — — — — 50,000(16) 1,234,000 84,000(3) 2,073,120
Scott C. Taylor ..................... 5/9/2008 25,000 — 19.99 5/9/2015 — — — —
9/10/2008 21,000 — 20.50 9/10/2015 — — — —
5/11/2009 69,000 3,000(4) 15.32 5/11/2016 6,000(17) 148,080 — —
6/10/2010 49,500 22,500(6) 14.44 6/10/2017 6,000(18) 148,080 — —
6/10/2011 — — — — 12,500(19) 308,500 34,435(9) 849,856
5/10/2012 — — — — 27,500(20) 678,700 46,200(3) 1,140,216
Enrique Salem...................... 6/22/2004 110,000 — 20.36 7/24/2013 — — — —
5/12/2006 175,000 — 17.02 5/12/2013 — — — —
5/10/2007 150,000 — 19.48 7/24/2013 — — — —
2/8/2008 55,000 — 17.90 7/24/2013 — — — —
5/9/2008 240,000 — 19.99 7/24/2013 — — — —
4/10/2009 510,000 — 17.13 7/24/2013 — — — —
6/10/2010 231,458 — 14.44 7/24/2013 — — — —
William T. Robbins ................. 2/17/2004 50,589 — 29.39 3/31/2013 — — — —
Janice D. Chaffin ...................10/20/2004 70,000 — 27.68 10/20/2014 — — — —
5/11/2009 57,500 2,500(4) 15.32 5/11/2016 7,500(21) 185,100 — —
6/10/2010 68,750 31,250(6) 14.44 6/10/2017 8,750(7) 215,950 — —
6/10/2011 — — — — 15,000(22) 370,200 41,322(9) 1,019,827
5/10/2012 — — — — 30,000(23) 740,400 50,400(3) 1,243,872
76