Symantec 2013 Annual Report Download - page 149
Download and view the complete annual report
Please find page 149 of the 2013 Symantec annual report below. You can navigate through the pages in the report by either clicking on the pages listed below, or by using the keyword search tool below to find specific information within the annual report.-
 1
1 -
2
-
3
-
4
-
5
-
6
-
7
-
8
-
9
-
10
-
11
-
12
-
13
-
14
-
15
-
16
-
17
-
18
-
19
-
20
-
21
-
22
-
23
-
24
-
25
-
26
-
27
-
28
-
29
-
30
-
31
-
32
-
33
-
34
-
35
-
36
-
37
-
38
-
39
-
40
-
41
-
42
-
43
-
44
-
45
-
46
-
47
-
48
-
49
-
50
-
51
-
52
-
53
-
54
-
55
-
56
-
57
-
58
-
59
-
60
-
61
-
62
-
63
-
64
-
65
-
66
-
67
-
68
-
69
-
70
-
71
-
72
-
73
-
74
-
75
-
76
-
77
-
78
-
79
-
80
-
81
-
82
-
83
-
84
-
85
-
86
-
87
-
88
-
89
-
90
-
91
-
92
-
93
-
94
-
95
-
96
-
97
-
98
-
99
-
100
-
101
-
102
-
103
-
104
-
105
-
106
-
107
-
108
-
109
-
110
-
111
-
112
-
113
-
114
-
115
-
116
-
117
-
118
-
119
-
120
-
121
-
122
-
123
-
124
-
125
-
126
-
127
-
128
-
129
-
130
-
131
-
132
-
133
-
134
-
135
-
136
-
137
-
138
-
 139
139 -
 140
140 -
 141
141 -
 142
142 -
 143
143 -
 144
144 -
 145
145 -
 146
146 -
 147
147 -
 148
148 -
 149
149 -
 150
150 -
 151
151 -
 152
152 -
 153
153 -
 154
154 -
 155
155 -
 156
156 -
 157
157 -
 158
158 -
 159
159 -
160
-
161
-
162
-
163
-
164
-
165
-
166
-
167
-
168
-
169
-
170
-
171
-
172
-
173
-
174
-
175
-
176
-
177
-
178
-
179
-
180
-
181
-
182
-
183
-
184
-
185
-
186
-
187
-
188
-
189
-
190
-
191
-
192
-
193
-
194
-
195
-
196
-
197
-
198
-
199
-
200
-
201
-
202
-
203
-
204
 |
 |

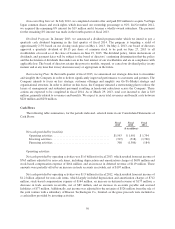
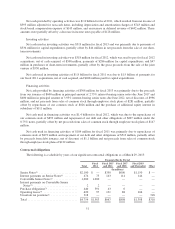
Net cash provided by operating activities was $1.8 billion for fiscal 2011, which resulted from net income of
$593 million adjusted for non-cash items, including depreciation and amortization charges of $743 million and
stock-based compensation expense of $145 million, and an increase in deferred revenue of $442 million. These
amounts were partially offset by a decrease in income taxes payable of $128 million.
Investing activities
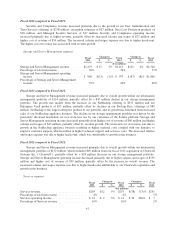
Net cash used in investing activities was $319 million for fiscal 2013 and was primarily due to payments of
$336 million for capital expenditures, partially offset by $46 million in net proceeds from the sale of our short-
term investments.
Net cash used in investing activities was $318 million for fiscal 2012, which was used to pay for fiscal 2012
acquisitions, net of cash acquired, of $508 million, payments of $286 million for capital expenditures, and $47
million in purchases of short-term investments, partially offset by the gross proceeds from the sale of the joint
venture of $530 million.
Net cash used in investing activities of $1.8 billion for fiscal 2011 was due to $1.5 billion of payments for
our fiscal 2011 acquisitions, net of cash acquired, and $268 million paid for capital expenditures.
Financing activities
Net cash provided by financing activities of $308 million for fiscal 2013 was primarily due to the proceeds
from our issuance of $600 million in principal amount of 2.75% interest-bearing senior notes due June 2017 and
$400 million in principal amount of 3.95% interest-bearing senior notes due June 2022, net of discount, of $996
million, and net proceeds from sales of common stock through employee stock plans of $281 million, partially
offset by repurchases of our common stock of $826 million and the purchase of additional equity interest in
subsidiary of $111 million.
Net cash used in financing activities was $1.4 billion for fiscal 2012, which was due to the repurchases of
our common stock of $893 million and repayment of our debt and other obligations of $607 million under the
0.75% notes, partially offset by net proceeds from sales of common stock through employee stock plans of $147
million.
Net cash used in financing activities of $184 million for fiscal 2011 was primarily due to repurchases of
common stock of $872 million and repayment of our debt and other obligations of $513 million, partially offset
by proceeds from debt issuance, net of discount, of $1.1 billion and net proceeds from sales of common stock
through employee stock plans of $122 million.
Contractual obligations
The following is a schedule by years of our significant contractual obligations as of March 29, 2013:
Payments Due by Period
Total
Fiscal
2014
Fiscal 2015
and 2016
Fiscal 2017
and 2018
Fiscal 2019
and Thereafter Other
(In millions)
Senior Notes(1) .......................... $2,100 $ — $350 $600 $1,150 $ —
Interest payments on Senior Notes(1) ......... 474 73 143 114 144 —
Convertible Senior Notes(2) ................ 1,000 1,000 — — — —
Interest payments on Convertible Senior
Notes(2) .............................. 2 2 — — — —
Purchase obligations(3) .................... 440 391 43 6 — —
Operating leases(4) ....................... 420 97 131 88 104 —
Uncertain tax positions(5) .................. 318 — — — — 318
Total .................................. $4.754 $1.563 $667 $808 $1,398 $318
51