Symantec 2013 Annual Report Download - page 6
Download and view the complete annual report
Please find page 6 of the 2013 Symantec annual report below. You can navigate through the pages in the report by either clicking on the pages listed below, or by using the keyword search tool below to find specific information within the annual report.-
 1
1 -
 2
2 -
 3
3 -
 4
4 -
 5
5 -
 6
6 -
 7
7 -
 8
8 -
 9
9 -
 10
10 -
 11
11 -
 12
12 -
 13
13 -
 14
14 -
 15
15 -
 16
16 -
 17
17 -
18
-
19
-
20
-
21
-
22
-
23
-
24
-
25
-
26
-
27
-
28
-
29
-
30
-
31
-
32
-
33
-
34
-
35
-
36
-
37
-
38
-
39
-
40
-
41
-
42
-
43
-
44
-
45
-
46
-
47
-
48
-
49
-
50
-
51
-
52
-
53
-
54
-
55
-
56
-
57
-
58
-
59
-
60
-
61
-
62
-
63
-
64
-
65
-
66
-
67
-
68
-
69
-
70
-
71
-
72
-
73
-
74
-
75
-
76
-
77
-
78
-
79
-
80
-
81
-
82
-
83
-
84
-
85
-
86
-
87
-
88
-
89
-
90
-
91
-
92
-
93
-
94
-
95
-
96
-
97
-
98
-
99
-
100
-
101
-
102
-
103
-
104
-
105
-
106
-
107
-
108
-
109
-
110
-
111
-
112
-
113
-
114
-
115
-
116
-
117
-
118
-
119
-
120
-
121
-
122
-
123
-
124
-
125
-
126
-
127
-
128
-
129
-
130
-
131
-
132
-
133
-
134
-
135
-
136
-
137
-
138
-
139
-
140
-
141
-
142
-
143
-
144
-
145
-
146
-
147
-
148
-
149
-
150
-
151
-
152
-
153
-
154
-
155
-
156
-
157
-
158
-
159
-
160
-
161
-
162
-
163
-
164
-
165
-
166
-
167
-
168
-
169
-
170
-
171
-
172
-
173
-
174
-
175
-
176
-
177
-
178
-
179
-
180
-
181
-
182
-
183
-
184
-
185
-
186
-
187
-
188
-
189
-
190
-
191
-
192
-
193
-
194
-
195
-
196
-
197
-
198
-
199
-
200
-
201
-
202
-
203
-
204
 |
 |

4
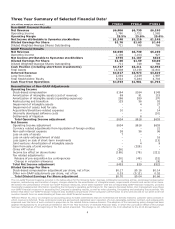
Three Year Summary of Selected Financial Data1
($ in millions, except per share data) FY2013 FY2012 FY2011
Non-GAAP Financial Results
Net Revenue $6,906 $6,730 $6,190
Operating Income 1,760 1,722 1,582
Operating Margin 25.5% 25.6% 25.6%
Net Income attributable to Symantec stockholders $1,248 $1,216 $1,148
Diluted Earnings Per Share $1.76 $1.63 $1.46
Diluted Weighted-Average Shares Outstanding 711 748 786
GAAP Financial Results
Net Revenue $6,906 $6,730 $6,190
Operating Income 1,106 1,104 927
Net Income attributable to Symantec stockholders $755 $1,187 $626
Diluted Earnings Per Share $1.06 $1.59 $0.80
Diluted Weighted-Average Shares Outstanding 711 748 786
Cash Position (including short-term investments) $4,747 $3,211 $2,958
Total Assets 14,508 13,158 12,841
Deferred Revenue $4,017 $3,973 $3,819
Long-Term Debt 2,094 2,039 1,987
Total Stockholders’ Equity 5,522 5,284 4,703
Cash Flow from Operations $1,593 $1,901 $1,794
Reconciliation of Non-GAAP Adjustments
Operating Income
Stock-based compensation $164 $164 $145
Amortization of intangible assets (cost of revenue) 69 91 115
Amortization of intangible assets (operating expenses) 286 289 270
Restructuring and transition 125 56 92
Impairment of intangible assets - 4 27
Impairment of assets held for sale - - 2
Acquisition/divestiture-related expenses 10 6 14
Internally developed software costs - - (10)
Settlements of litigation - 8 -
Total Operating Income adjustment $654 $618 $655
Net Income
Operating Income adjustment $654 $618 $655
Currency related adjustments from liquidation of foreign entities - - 21
Non-cash interest expense 58 56 96
Loss on sale of assets 7 - -
Loss on early extinguishment of debt - - 16
Loss (gain) on sale of short-term investments - 1 (13)
Joint venture: Amortization of intangible assets - 4 9
Gain from sale of joint venture - (526) -
China VAT refund (26) - -
Income tax effect on above items (186) (76) (221)
Tax related adjustments:
Release of pre-acquisition tax contingencies (20) (48) (32)
Change in valuation allowance 6 - (9)
Total Net Income adjustment $493 $29 $522
Diluted Earnings Per Share
Stock-based compensation adjustment per share, net of tax $0.17 $0.16 $0.14
Other non-GAAP adjustments per share, net of tax 0.53 (0.12) 0.52
Total Diluted Earnings Per Share adjustment $0.70 $0.04 $0.66
The non-GAAP nancial measures included in the tables adjust for the following items: business combination accounting entries, stock-based compensation
expense, restructuring and transition charges, charges related to the amortization of intangible assets, impairments of assets and certain other items.
We believe the presentation of these non-GAAP nancial measures, when taken together with the corresponding GAAP nancial measures, provides
meaningful supplemental information regarding the Company’s operating performance for the reasons discussed below. Our management uses these
non-GAAP nancial measures in assessing the Company’s operating results, as well as when planning, forecasting and analyzing future periods. We
believe that these non-GAAP nancial measures also facilitate comparisons of the Company’s performance to prior periods and to our peers and that
investors benet from an understanding of these non-GAAP nancial measures.
1
Effective March 30, 2013, we changed our accounting policy for sales commissions that are incremental and directly related to customer sales contracts in
which revenue is deferred. These commission costs are accrued and capitalized upon execution of a non-cancelable customer contract, and subsequently
expensed over the term of such contract in proportion to the related future revenue streams. The adoption of this accounting policy change has been
applied retrospectively to all periods presented in this Three Year Summary of Selected Financial Data, in which the cumulative effect of the change
has been reected as of the beginning of the rst period presented. This change is not reected in the 10-K attached to the 2013 Annual Report.