Symantec 2013 Annual Report Download - page 142
Download and view the complete annual report
Please find page 142 of the 2013 Symantec annual report below. You can navigate through the pages in the report by either clicking on the pages listed below, or by using the keyword search tool below to find specific information within the annual report.-
 1
1 -
2
-
3
-
4
-
5
-
6
-
7
-
8
-
9
-
10
-
11
-
12
-
13
-
14
-
15
-
16
-
17
-
18
-
19
-
20
-
21
-
22
-
23
-
24
-
25
-
26
-
27
-
28
-
29
-
30
-
31
-
32
-
33
-
34
-
35
-
36
-
37
-
38
-
39
-
40
-
41
-
42
-
43
-
44
-
45
-
46
-
47
-
48
-
49
-
50
-
51
-
52
-
53
-
54
-
55
-
56
-
57
-
58
-
59
-
60
-
61
-
62
-
63
-
64
-
65
-
66
-
67
-
68
-
69
-
70
-
71
-
72
-
73
-
74
-
75
-
76
-
77
-
78
-
79
-
80
-
81
-
82
-
83
-
84
-
85
-
86
-
87
-
88
-
89
-
90
-
91
-
92
-
93
-
94
-
95
-
96
-
97
-
98
-
99
-
100
-
101
-
102
-
103
-
104
-
105
-
106
-
107
-
108
-
109
-
110
-
111
-
112
-
113
-
114
-
115
-
116
-
117
-
118
-
119
-
120
-
121
-
122
-
123
-
124
-
125
-
126
-
127
-
128
-
129
-
130
-
131
-
 132
132 -
 133
133 -
 134
134 -
 135
135 -
 136
136 -
 137
137 -
 138
138 -
 139
139 -
 140
140 -
 141
141 -
 142
142 -
 143
143 -
 144
144 -
 145
145 -
 146
146 -
 147
147 -
 148
148 -
 149
149 -
 150
150 -
 151
151 -
 152
152 -
153
-
154
-
155
-
156
-
157
-
158
-
159
-
160
-
161
-
162
-
163
-
164
-
165
-
166
-
167
-
168
-
169
-
170
-
171
-
172
-
173
-
174
-
175
-
176
-
177
-
178
-
179
-
180
-
181
-
182
-
183
-
184
-
185
-
186
-
187
-
188
-
189
-
190
-
191
-
192
-
193
-
194
-
195
-
196
-
197
-
198
-
199
-
200
-
201
-
202
-
203
-
204
 |
 |

Fiscal 2013 compared to Fiscal 2012:
Cost of content, subscription, and maintenance consists primarily of technical support costs, costs of billable
services, and fees to OEMs under revenue-sharing agreements. Cost of content, subscription, and maintenance
increased primarily due to higher technical support, services, and OEM royalty costs. The increased costs were
due to growth in our business and higher royalty payments to major OEM partners as part of revenue-sharing
arrangements. Cost of content, subscription, and maintenance as a percentage of related revenue remained
consistent. Cost of license consists primarily of royalties paid to third parties under technology licensing
agreements, appliance manufacturing costs, and other direct material costs. Cost of license and cost of license as
a percentage of related revenue increased primarily due to the higher direct costs associated with the appliance
business.
Intangible assets are comprised of developed technologies and patents from acquired companies.
Amortization decreased due to certain developed technologies becoming fully amortized, partially offset by the
incremental amortization associated with our fiscal 2012 acquisitions of Clearwell and LiveOffice.
Fiscal 2012 compared to Fiscal 2011:
Cost of content, subscription, and maintenance increased primarily due to higher royalty and technical
support costs, which were partially offset by lower services costs. The increased royalty costs were mainly
associated with increased revenue related to the authentication services and hosted services. The lower services
cost was primarily due to our transitioning of our consulting services to specialized partners. Cost of license and
cost of license as a percentage of related revenue increased primarily due to the higher direct costs associated
with the appliance business.
Intangible assets amortization decreased due to certain developed technologies becoming fully amortized,
partially offset by the incremental amortization associated with our 2011 acquisitions of the identity and
authentication business of VeriSign, Inc. (“VeriSign”), PGP Corporation (“PGP”), and GuardianEdge
Technologies, Inc. (“GuardianEdge”).
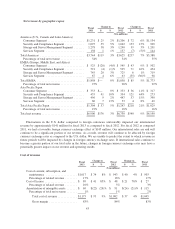
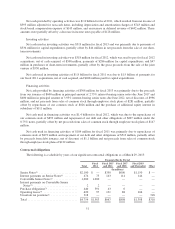
Operating expenses
Fiscal
2013
Change in Fiscal
2012
Change in Fiscal
2011$ % $ %
($ in millions)
Sales and marketing expense ........... $2,735 $(79) (3)% $2,814 $192 7% $2,622
Percentage of total net revenue ......... 40% 42% 42%
Research and development expense ..... $1,012 $ 43 4% $ 969 $107 12% $ 862
Percentage of total net revenue ......... 15% 14% 14%
General and administrative expense ..... $ 450 $13 3% $ 437 $ 47 12% $ 390
Percentage of total net revenue ......... 7% 6% 6%
Amortization of intangible assets ....... $ 286 $ (3) (1)% $ 289 $ 19 7% $ 270
Percentage of total net revenue ......... 4% 4% 4%
Restructuring and transition ........... $ 125 $69 * $ 56 $(36) * $ 92
Percentage of total net revenue ......... 2% 1% 1%
Impairment of intangible assets ......... — $ (4) * $ 4 $(23) * $ 27
Percentage of total net revenue ......... 0% 0% 0%
Loss and impairment of assets held for
sale ............................. — $— * — $ (2) * $ 2
Percentage of total net revenue ......... 0% 0% 0%
* Percentage not meaningful
44