Symantec 2013 Annual Report Download - page 128
Download and view the complete annual report
Please find page 128 of the 2013 Symantec annual report below. You can navigate through the pages in the report by either clicking on the pages listed below, or by using the keyword search tool below to find specific information within the annual report.-
 1
1 -
2
-
3
-
4
-
5
-
6
-
7
-
8
-
9
-
10
-
11
-
12
-
13
-
14
-
15
-
16
-
17
-
18
-
19
-
20
-
21
-
22
-
23
-
24
-
25
-
26
-
27
-
28
-
29
-
30
-
31
-
32
-
33
-
34
-
35
-
36
-
37
-
38
-
39
-
40
-
41
-
42
-
43
-
44
-
45
-
46
-
47
-
48
-
49
-
50
-
51
-
52
-
53
-
54
-
55
-
56
-
57
-
58
-
59
-
60
-
61
-
62
-
63
-
64
-
65
-
66
-
67
-
68
-
69
-
70
-
71
-
72
-
73
-
74
-
75
-
76
-
77
-
78
-
79
-
80
-
81
-
82
-
83
-
84
-
85
-
86
-
87
-
88
-
89
-
90
-
91
-
92
-
93
-
94
-
95
-
96
-
97
-
98
-
99
-
100
-
101
-
102
-
103
-
104
-
105
-
106
-
107
-
108
-
109
-
110
-
111
-
112
-
113
-
114
-
115
-
116
-
117
-
 118
118 -
 119
119 -
 120
120 -
 121
121 -
 122
122 -
 123
123 -
 124
124 -
 125
125 -
 126
126 -
 127
127 -
 128
128 -
 129
129 -
 130
130 -
 131
131 -
 132
132 -
 133
133 -
 134
134 -
 135
135 -
 136
136 -
 137
137 -
 138
138 -
139
-
140
-
141
-
142
-
143
-
144
-
145
-
146
-
147
-
148
-
149
-
150
-
151
-
152
-
153
-
154
-
155
-
156
-
157
-
158
-
159
-
160
-
161
-
162
-
163
-
164
-
165
-
166
-
167
-
168
-
169
-
170
-
171
-
172
-
173
-
174
-
175
-
176
-
177
-
178
-
179
-
180
-
181
-
182
-
183
-
184
-
185
-
186
-
187
-
188
-
189
-
190
-
191
-
192
-
193
-
194
-
195
-
196
-
197
-
198
-
199
-
200
-
201
-
202
-
203
-
204
 |
 |

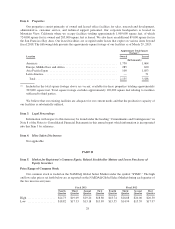
Stock performance graph
This performance graph shall not be deemed “filed” for purposes of Section 18 of the Exchange Act or
otherwise subject to the liabilities under that Section, and shall not be deemed to be incorporated by reference
into any filing of Symantec under the Securities Act or the Exchange Act.
The graph below compares the cumulative total stockholder return on our common stock with the
cumulative total return on the S&P 500 Composite Index and the S&P Information Technology Index for the five
years ended March 29, 2013 (assuming the investment of $100 in our common stock and in each of the other
indices on the last day of trading for the fiscal 2008, and the reinvestment of all dividends, although no dividends
have been declared on our common stock). The comparisons in the graph below are based on historical data and
are not intended to forecast the possible future performance of our common stock.
COMPARISON OF FIVE-YEAR CUMULATIVE TOTAL RETURN
Among Symantec Corporation, The S&P 500 Index
And The S&P Information Technology Index
150
50
2008 2009 2010 2011 2012 2013
75
100
DOLLARS
125
Symantec Corporation
S&P 500
S&P Information Technology
Fiscal Year 2008 2009 2010 2011 2012 2013
Symantec Corporation 100.00 96.49 99.70 109.75 111.18 146.73
S&P 500 100.00 65.77 93.95 108.38 117.05 133.40
S&P Information Technology 100.00 75.28 111.35 124.36 149.62 147.94
30