Symantec 2013 Annual Report Download - page 126
Download and view the complete annual report
Please find page 126 of the 2013 Symantec annual report below. You can navigate through the pages in the report by either clicking on the pages listed below, or by using the keyword search tool below to find specific information within the annual report.-
 1
1 -
2
-
3
-
4
-
5
-
6
-
7
-
8
-
9
-
10
-
11
-
12
-
13
-
14
-
15
-
16
-
17
-
18
-
19
-
20
-
21
-
22
-
23
-
24
-
25
-
26
-
27
-
28
-
29
-
30
-
31
-
32
-
33
-
34
-
35
-
36
-
37
-
38
-
39
-
40
-
41
-
42
-
43
-
44
-
45
-
46
-
47
-
48
-
49
-
50
-
51
-
52
-
53
-
54
-
55
-
56
-
57
-
58
-
59
-
60
-
61
-
62
-
63
-
64
-
65
-
66
-
67
-
68
-
69
-
70
-
71
-
72
-
73
-
74
-
75
-
76
-
77
-
78
-
79
-
80
-
81
-
82
-
83
-
84
-
85
-
86
-
87
-
88
-
89
-
90
-
91
-
92
-
93
-
94
-
95
-
96
-
97
-
98
-
99
-
100
-
101
-
102
-
103
-
104
-
105
-
106
-
107
-
108
-
109
-
110
-
111
-
112
-
113
-
114
-
115
-
 116
116 -
 117
117 -
 118
118 -
 119
119 -
 120
120 -
 121
121 -
 122
122 -
 123
123 -
 124
124 -
 125
125 -
 126
126 -
 127
127 -
 128
128 -
 129
129 -
 130
130 -
 131
131 -
 132
132 -
 133
133 -
 134
134 -
 135
135 -
 136
136 -
137
-
138
-
139
-
140
-
141
-
142
-
143
-
144
-
145
-
146
-
147
-
148
-
149
-
150
-
151
-
152
-
153
-
154
-
155
-
156
-
157
-
158
-
159
-
160
-
161
-
162
-
163
-
164
-
165
-
166
-
167
-
168
-
169
-
170
-
171
-
172
-
173
-
174
-
175
-
176
-
177
-
178
-
179
-
180
-
181
-
182
-
183
-
184
-
185
-
186
-
187
-
188
-
189
-
190
-
191
-
192
-
193
-
194
-
195
-
196
-
197
-
198
-
199
-
200
-
201
-
202
-
203
-
204
 |
 |

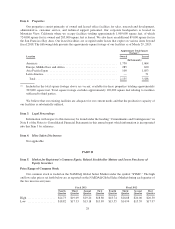
Item 2. Properties
Our properties consist primarily of owned and leased office facilities for sales, research and development,
administrative, customer service, and technical support personnel. Our corporate headquarters is located in
Mountain View, California where we occupy facilities totaling approximately 1,009,000 square feet, of which
724,000 square feet is owned and 285,000 square feet is leased. We also lease an additional 89,000 square feet in
the San Francisco Bay Area. Our leased facilities are occupied under leases that expire on various dates beyond
fiscal 2018. The following table presents the approximate square footage of our facilities as of March 29, 2013:
Approximate Total Square
Footage(1)
Location Owned Leased
(In thousands)
Americas ..................................................... 1,750 1,064
Europe, Middle East, and Africa ................................... 285 620
Asia Pacific/Japan .............................................. 100 1,853
Latin America ................................................. — 51
Total ....................................................... 2,135 3,588
(1) Included in the total square footage above are vacant, available-for-lease properties totaling approximately
303,000 square feet. Total square footage excludes approximately 102,000 square feet relating to facilities
subleased to third parties.
We believe that our existing facilities are adequate for our current needs and that the productive capacity of
our facilities is substantially utilized.
Item 3. Legal Proceedings
Information with respect to this item may be found under the heading “Commitments and Contingencies” in
Note 8 of the Notes to Consolidated Financial Statements in this annual report which information is incorporated
into this Item 3 by reference.
Item 4. Mine Safety Disclosures
Not applicable.
PART II
Item 5. Market for Registrant’s Common Equity, Related Stockholder Matters and Issuer Purchases of
Equity Securities
Price Range of Common Stock
Our common stock is traded on the NASDAQ Global Select Market under the symbol “SYMC.” The high
and low sales prices set forth below are as reported on the NASDAQ Global Select Market during each quarter of
the two most recent years.
Fiscal 2013 Fiscal 2012
Fourth
Quarter
Third
Quarter
Second
Quarter
First
Quarter
Fourth
Quarter
Third
Quarter
Second
Quarter
First
Quarter
High ................... $24.73 $19.09 $19.20 $18.80 $18.74 $18.88 $20.00 $20.50
Low ................... $18.82 $17.33 $13.18 $13.89 $15.55 $14.94 $15.39 $17.97
28