Symantec 2013 Annual Report Download - page 129
Download and view the complete annual report
Please find page 129 of the 2013 Symantec annual report below. You can navigate through the pages in the report by either clicking on the pages listed below, or by using the keyword search tool below to find specific information within the annual report.-
 1
1 -
2
-
3
-
4
-
5
-
6
-
7
-
8
-
9
-
10
-
11
-
12
-
13
-
14
-
15
-
16
-
17
-
18
-
19
-
20
-
21
-
22
-
23
-
24
-
25
-
26
-
27
-
28
-
29
-
30
-
31
-
32
-
33
-
34
-
35
-
36
-
37
-
38
-
39
-
40
-
41
-
42
-
43
-
44
-
45
-
46
-
47
-
48
-
49
-
50
-
51
-
52
-
53
-
54
-
55
-
56
-
57
-
58
-
59
-
60
-
61
-
62
-
63
-
64
-
65
-
66
-
67
-
68
-
69
-
70
-
71
-
72
-
73
-
74
-
75
-
76
-
77
-
78
-
79
-
80
-
81
-
82
-
83
-
84
-
85
-
86
-
87
-
88
-
89
-
90
-
91
-
92
-
93
-
94
-
95
-
96
-
97
-
98
-
99
-
100
-
101
-
102
-
103
-
104
-
105
-
106
-
107
-
108
-
109
-
110
-
111
-
112
-
113
-
114
-
115
-
116
-
117
-
118
-
 119
119 -
 120
120 -
 121
121 -
 122
122 -
 123
123 -
 124
124 -
 125
125 -
 126
126 -
 127
127 -
 128
128 -
 129
129 -
 130
130 -
 131
131 -
 132
132 -
 133
133 -
 134
134 -
 135
135 -
 136
136 -
 137
137 -
 138
138 -
 139
139 -
140
-
141
-
142
-
143
-
144
-
145
-
146
-
147
-
148
-
149
-
150
-
151
-
152
-
153
-
154
-
155
-
156
-
157
-
158
-
159
-
160
-
161
-
162
-
163
-
164
-
165
-
166
-
167
-
168
-
169
-
170
-
171
-
172
-
173
-
174
-
175
-
176
-
177
-
178
-
179
-
180
-
181
-
182
-
183
-
184
-
185
-
186
-
187
-
188
-
189
-
190
-
191
-
192
-
193
-
194
-
195
-
196
-
197
-
198
-
199
-
200
-
201
-
202
-
203
-
204
 |
 |

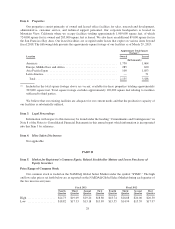
Item 6. Selected Financial Data
The following selected consolidated financial data is derived from our Consolidated Financial Statements.
This data should be read in conjunction with our Consolidated Financial Statements and related notes included in
this annual report and with Item 7, Management’s Discussion and Analysis of Financial Condition and Results of
Operations. Historical results may not be indicative of future results.
Five-Year Summary
Fiscal (a)
2013 2012 2011 2010 2009
(In millions, except per share data)
Consolidated Statements of Income Data:
Net revenue .................................... $ 6,906 $ 6,730 $ 6,190 $ 5,985 $ 6,150
Operating income (loss)(b) ......................... 1,123 1,079 880 933 (6,470)
Net income (loss) attributable to Symantec Corporation
stockholders(b)(c) ............................... $ 765 $ 1,172 $ 597 $ 714 $ (6,786)
Net income (loss) per share attributable to Symantec
Corporation stockholders — basic(b)(c) .............. $ 1.09 $ 1.58 $ 0.77 $ 0.88 $ (8.17)
Net income (loss) per share attributable to Symantec
Corporation stockholders — diluted(b)(c) ............ $ 1.08 $ 1.57 $ 0.76 $ 0.87 $ (8.17)
Weighted-average shares outstanding attributable to
Symantec Corporation stockholders — basic ........ 701 741 778 810 831
Weighted-average shares outstanding attributable to
Symantec Corporation stockholders — diluted ....... 711 748 786 819 831
Consolidated Balance Sheet Data:
Cash and cash equivalents ......................... $ 4,685 $ 3,162 $ 2,950 $ 3,029 $ 1,793
Total assets(b) ................................... 14,379 13,020 12,719 11,232 10,638
Deferred revenue ................................ 3,496 3,444 3,321 2,835 2,644
Current portion of long-term debt(d) .................. 997 — 596 — —
Long-term debt(d)(e) ............................... 2,094 2,039 1,987 1,871 1,766
Long-term deferred revenue ........................ 521 529 498 371 419
Symantec Corporation stockholders’ equity(b) .......... $ 5,421 $ 5,094 $ 4,528 $ 4,548 $ 4,147
Noncontrolling interest in subsidiary ................. — 78 77 — —
Total stockholders’ equity(b) ........................ $ 5,421 $ 5,172 $ 4,605 $ 4,548 $ 4,147
(a) We have a 52/53-week fiscal year. Fiscal 2013, 2012, 2011, and 2010 were each comprised of 52 weeks of
operations. Fiscal 2009 was comprised of 53 weeks of operations.
(b) During fiscal 2009, we recorded a non-cash goodwill impairment charge of $7.4 billion.
(c) In fiscal 2008, we formed a joint venture with a subsidiary of Huawei Technologies Co., Limited
(“Huawei”). In fiscal 2012, we sold our 49% ownership interest in the joint venture to Huawei for $530
million in cash. The gain of $530 million, offset by costs to sell the joint venture of $4 million, was included
in Gain from sale of joint venture in our fiscal 2012 Consolidated Statements of Income.
(d) In fiscal 2007, we issued $1.1 billion principal amount of 0.75% convertible senior notes (“0.75% notes”)
and $1.0 billion principal amount of 1.00% convertible senior notes (“1.00% notes”). In fiscal 2011, we
repurchased $500 million aggregate principal amount of our 0.75% notes. In fiscal 2012, the remaining
balance of our 0.75% notes matured and we settled with the holders with a cash payment of $600 million.
(e) In fiscal 2011, we issued $350 million in principal amount of 2.75% senior notes due September 2015
(“2.75% notes due 2015”) and $750 million in principal amount of 4.20% senior notes due September 2020
(“4.20% notes”). In fiscal 2013, we issued $600 million in principal amount of 2.75% senior notes due
June 2017 (“2.75% notes due 2017”) and $400 million in principal amount of 3.95% senior notes due June
2022 (“3.95% notes”).
31