Symantec 2013 Annual Report Download - page 139
Download and view the complete annual report
Please find page 139 of the 2013 Symantec annual report below. You can navigate through the pages in the report by either clicking on the pages listed below, or by using the keyword search tool below to find specific information within the annual report.-
 1
1 -
2
-
3
-
4
-
5
-
6
-
7
-
8
-
9
-
10
-
11
-
12
-
13
-
14
-
15
-
16
-
17
-
18
-
19
-
20
-
21
-
22
-
23
-
24
-
25
-
26
-
27
-
28
-
29
-
30
-
31
-
32
-
33
-
34
-
35
-
36
-
37
-
38
-
39
-
40
-
41
-
42
-
43
-
44
-
45
-
46
-
47
-
48
-
49
-
50
-
51
-
52
-
53
-
54
-
55
-
56
-
57
-
58
-
59
-
60
-
61
-
62
-
63
-
64
-
65
-
66
-
67
-
68
-
69
-
70
-
71
-
72
-
73
-
74
-
75
-
76
-
77
-
78
-
79
-
80
-
81
-
82
-
83
-
84
-
85
-
86
-
87
-
88
-
89
-
90
-
91
-
92
-
93
-
94
-
95
-
96
-
97
-
98
-
99
-
100
-
101
-
102
-
103
-
104
-
105
-
106
-
107
-
108
-
109
-
110
-
111
-
112
-
113
-
114
-
115
-
116
-
117
-
118
-
119
-
120
-
121
-
122
-
123
-
124
-
125
-
126
-
127
-
128
-
 129
129 -
 130
130 -
 131
131 -
 132
132 -
 133
133 -
 134
134 -
 135
135 -
 136
136 -
 137
137 -
 138
138 -
 139
139 -
 140
140 -
 141
141 -
 142
142 -
 143
143 -
 144
144 -
 145
145 -
 146
146 -
 147
147 -
 148
148 -
 149
149 -
150
-
151
-
152
-
153
-
154
-
155
-
156
-
157
-
158
-
159
-
160
-
161
-
162
-
163
-
164
-
165
-
166
-
167
-
168
-
169
-
170
-
171
-
172
-
173
-
174
-
175
-
176
-
177
-
178
-
179
-
180
-
181
-
182
-
183
-
184
-
185
-
186
-
187
-
188
-
189
-
190
-
191
-
192
-
193
-
194
-
195
-
196
-
197
-
198
-
199
-
200
-
201
-
202
-
203
-
204
 |
 |

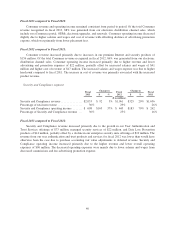
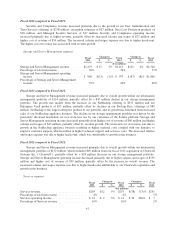
Fiscal 2012 compared to Fiscal 2011:
Security and Compliance revenue increased primarily due to the growth in our User Authentication and
Trust Services offerings of $238 million, encryption solutions of $27 million, Data Loss Protection products of
$18 million, and Managed Security Services of $17 million. Security and Compliance operating income
increased primarily due to higher revenue, partially offset by increased salaries and wages of $71 million and
higher cost of revenue of $54 million. The increased salaries and wages expense was due to higher headcount.
The higher cost of revenue was associated with revenue growth.
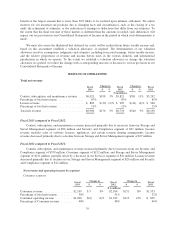
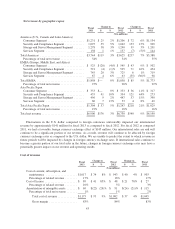
Storage and Server Management segment
Fiscal
2013
Change in Fiscal
2012
Change in Fiscal
2011$ % $ %
($ in millions)
Storage and Server Management revenue ........ $2,479 $ 67 3% $2,412 $102 4% $2,310
Percentage of total net revenue ................ 36% 36% 37%
Storage and Server Management operating
income ................................. $ 960 $(13) (1)% $ 973 $ (87) (8)% $1,060
Percentage of Storage and Server Management
revenue ................................ 39% 40% 46%
Fiscal 2013 compared to Fiscal 2012:
Storage and Server Management revenue increased primarily due to overall growth within our information
management portfolio of $114 million, partially offset by a $47 million decline in our storage management
portfolio. The growth was mainly from the increase in our NetBackup offering of $151 million and our
Enterprise Vault products of $35 million, partially offset by declines in our Backup Exec offerings of $80
million. NetBackup is the largest enterprise product in our portfolio, and its growth has benefited from increased
sales of our NetBackup appliance business. The decline in our storage management portfolio was driven by the
previously disclosed headwinds we face from less use by our customers of the Solaris platform. Storage and
Server Management operating income decreased primarily from higher cost of revenue of $60 million and higher
salaries and wages of $23 million, partially offset by revenue growth. The increased cost of revenue was due to
growth in the NetBackup appliance business resulting in higher material costs coupled with our initiative to
improve customer support, which resulted in higher technical support and services costs. The increased salaries
and wages expense was due to higher headcount, which was attributable to growth in the business.
Fiscal 2012 compared to Fiscal 2011:
Storage and Server Management revenue increased primarily due to overall growth within our information
management portfolio of $132 million, which included $49 million from our fiscal 2012 acquisition of Clearwell
Systems Inc. (“Clearwell”), partially offset by a $28 million decrease in our storage management portfolio.
Storage and Server Management operating income decreased primarily due to higher salaries and wages of $139
million and higher cost of revenue of $59 million, partially offset by the increase in overall revenue. The
increased salaries and wages expense was due to higher headcount attributable to our Clearwell acquisition and
growth in the business.
Services segment
Fiscal
2013
Change in Fiscal
2012
Change in Fiscal
2011$ % $ %
($ in millions)
Services revenue .............................. $265 $12 5% $253 $(38) (13)% $291
Percentage of total net revenue ................... 4% 4% 5%
Services operating income ....................... $ 43 $ 2 5% $ 41 $34 486% $ 7
Percentage of Services revenue ................... 16% 16% 2%
41