Symantec 2013 Annual Report Download - page 140
Download and view the complete annual report
Please find page 140 of the 2013 Symantec annual report below. You can navigate through the pages in the report by either clicking on the pages listed below, or by using the keyword search tool below to find specific information within the annual report.-
 1
1 -
2
-
3
-
4
-
5
-
6
-
7
-
8
-
9
-
10
-
11
-
12
-
13
-
14
-
15
-
16
-
17
-
18
-
19
-
20
-
21
-
22
-
23
-
24
-
25
-
26
-
27
-
28
-
29
-
30
-
31
-
32
-
33
-
34
-
35
-
36
-
37
-
38
-
39
-
40
-
41
-
42
-
43
-
44
-
45
-
46
-
47
-
48
-
49
-
50
-
51
-
52
-
53
-
54
-
55
-
56
-
57
-
58
-
59
-
60
-
61
-
62
-
63
-
64
-
65
-
66
-
67
-
68
-
69
-
70
-
71
-
72
-
73
-
74
-
75
-
76
-
77
-
78
-
79
-
80
-
81
-
82
-
83
-
84
-
85
-
86
-
87
-
88
-
89
-
90
-
91
-
92
-
93
-
94
-
95
-
96
-
97
-
98
-
99
-
100
-
101
-
102
-
103
-
104
-
105
-
106
-
107
-
108
-
109
-
110
-
111
-
112
-
113
-
114
-
115
-
116
-
117
-
118
-
119
-
120
-
121
-
122
-
123
-
124
-
125
-
126
-
127
-
128
-
129
-
 130
130 -
 131
131 -
 132
132 -
 133
133 -
 134
134 -
 135
135 -
 136
136 -
 137
137 -
 138
138 -
 139
139 -
 140
140 -
 141
141 -
 142
142 -
 143
143 -
 144
144 -
 145
145 -
 146
146 -
 147
147 -
 148
148 -
 149
149 -
 150
150 -
151
-
152
-
153
-
154
-
155
-
156
-
157
-
158
-
159
-
160
-
161
-
162
-
163
-
164
-
165
-
166
-
167
-
168
-
169
-
170
-
171
-
172
-
173
-
174
-
175
-
176
-
177
-
178
-
179
-
180
-
181
-
182
-
183
-
184
-
185
-
186
-
187
-
188
-
189
-
190
-
191
-
192
-
193
-
194
-
195
-
196
-
197
-
198
-
199
-
200
-
201
-
202
-
203
-
204
 |
 |

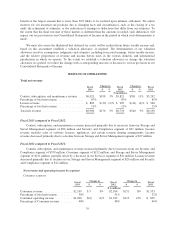
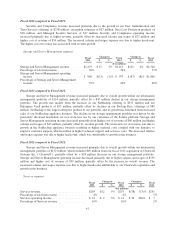
Fiscal 2013 compared to Fiscal 2012:
Services revenue increased primarily due to higher sales from our Business Critical Services offering, while
Services operating income remained consistent.
Fiscal 2012 compared to Fiscal 2011:
Services revenue decreased as we transitioned certain consulting services to specialized partners allowing us
to focus on our core software business. Services operating income increased primarily due to lower cost of
revenue and salaries and wages as we transitioned certain consulting services to our partner led consulting
program.
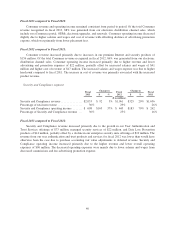
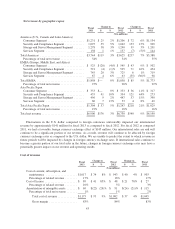
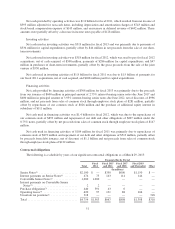
Other segment
Fiscal
2013
Change in Fiscal
2012
Change in Fiscal
2011$ % $ %
($ in millions)
Other revenue ........................... $ — $— NA $ — $— NA $ —
Percentage of total net revenue ............. 0% 0% 0%
Other operating loss ...................... $(1,494) $(102) 7% $(1,392) $ (44) 3% $(1,348)
Percentage of Other revenue ............... * * *
* Percentage not meaningful
Our Other segment consists primarily of sunset products and products nearing the end of their life cycle.
The operating loss of our Other segment includes certain general and administrative expenses, amortization of
intangible and other assets, charges such as stock-based compensation, restructuring and transition expenses, and
certain indirect costs that are not charged to the other operating segments.
42