Symantec 2013 Annual Report Download - page 64
Download and view the complete annual report
Please find page 64 of the 2013 Symantec annual report below. You can navigate through the pages in the report by either clicking on the pages listed below, or by using the keyword search tool below to find specific information within the annual report.-
 1
1 -
2
-
3
-
4
-
5
-
6
-
7
-
8
-
9
-
10
-
11
-
12
-
13
-
14
-
15
-
16
-
17
-
18
-
19
-
20
-
21
-
22
-
23
-
24
-
25
-
26
-
27
-
28
-
29
-
30
-
31
-
32
-
33
-
34
-
35
-
36
-
37
-
38
-
39
-
40
-
41
-
42
-
43
-
44
-
45
-
46
-
47
-
48
-
49
-
50
-
51
-
52
-
53
-
 54
54 -
 55
55 -
 56
56 -
 57
57 -
 58
58 -
 59
59 -
 60
60 -
 61
61 -
 62
62 -
 63
63 -
 64
64 -
 65
65 -
 66
66 -
 67
67 -
 68
68 -
 69
69 -
 70
70 -
 71
71 -
 72
72 -
 73
73 -
 74
74 -
75
-
76
-
77
-
78
-
79
-
80
-
81
-
82
-
83
-
84
-
85
-
86
-
87
-
88
-
89
-
90
-
91
-
92
-
93
-
94
-
95
-
96
-
97
-
98
-
99
-
100
-
101
-
102
-
103
-
104
-
105
-
106
-
107
-
108
-
109
-
110
-
111
-
112
-
113
-
114
-
115
-
116
-
117
-
118
-
119
-
120
-
121
-
122
-
123
-
124
-
125
-
126
-
127
-
128
-
129
-
130
-
131
-
132
-
133
-
134
-
135
-
136
-
137
-
138
-
139
-
140
-
141
-
142
-
143
-
144
-
145
-
146
-
147
-
148
-
149
-
150
-
151
-
152
-
153
-
154
-
155
-
156
-
157
-
158
-
159
-
160
-
161
-
162
-
163
-
164
-
165
-
166
-
167
-
168
-
169
-
170
-
171
-
172
-
173
-
174
-
175
-
176
-
177
-
178
-
179
-
180
-
181
-
182
-
183
-
184
-
185
-
186
-
187
-
188
-
189
-
190
-
191
-
192
-
193
-
194
-
195
-
196
-
197
-
198
-
199
-
200
-
201
-
202
-
203
-
204
 |
 |

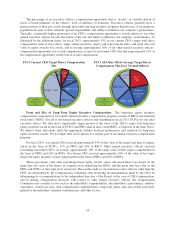
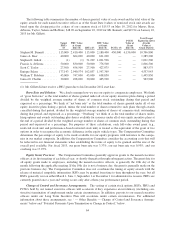
The percentage of an executive officer’s compensation opportunity that is “at-risk,” or variable instead of
fixed, is based primarily on the officer’s level of influence at Symantec. Executive officers generally have a
greater portion of their pay at risk through short-and long-term incentive programs than the rest of our employee
population because of their relatively greater responsibility and ability to influence our company’s performance.
Typically, a materially higher proportion of the CEO’s compensation opportunity is at-risk relative to our other
named executive officers because the nature of his role and ability to influence our company’s performance. As
illustrated by the following charts, for fiscal 2013, approximately 93% of our current CEO’s target total direct
compensation (sum of base salary, target annual incentive, target cash long-term-incentive and grant date fair
value of equity awards) was at-risk, and on average approximately 78% of our other named executive officers’
compensation opportunity was at-risk compensation, except for our former CEO who had approximately 91% of
his compensation opportunity in the form of at-risk compensation.
FY13 Current CEO Target Direct Compensation
Mix
Cash LTIP
5%
RSU 16%
PCSU* 44% PRU* 17%
Base
7%
Annual
Incentive
11%
At-Risk
Compensation:
93%
FY13 All Other NEOs Average Target Direct
Compensation Mix-Excl. Termed Officers
Cash LTIP
11%
RSU 26%
PRU* 18%
Base
22%
At-Risk
Compensation:
78%
Annual
Incentive
23%
Form and Mix of Long-Term Equity Incentive Compensation: The long-term equity incentive
compensation component of our regular annual executive compensation program consists of PRUs and restricted
stock units (“RSUs”) for all of our named executive officers and, beginning in fiscal 2013, PCSUs for our chief
executive officer. We allocated a significantly larger portion of the value of the CEO’s target total long-term
equity incentive award in the form of PCSUs and PRUs than in time-vested RSUs, as depicted in the chart above.
We believe these allocations strike the appropriate balance between performance and retention for long-term
equity incentive awards. We no longer offer stock options as a regular part of our annual executive compensation
program.
For fiscal 2013, our current CEO received approximately 44% of the value of his target total direct compen-
sation in the form of PCSUs, 17% in PRUs and 16% in RSUs. Other named executive officers received
(excluding our former CEO), on average, approximately 18% of the target value of their equity compensation in
the form of PRUs and 26% in RSUs. Our former CEO received approximately 34% of the value of his target
long-term equity incentive award compensation in the form of PRUs and 18% in RSUs.
These percentages (and other percentage-based equity awards values discussed below) are based on the
grant date fair value of the shares of common stock underlying the RSUs, and the grant date fair value of the
PRUs and PCSUs at the target level award size. The awards made to our named executive officers, other than the
CEO, are determined by the Compensation Committee after reviewing recommendations made by the CEO. In
determining its recommendations to the independent directors of the Board, in the case of CEO compensation,
and in making compensation decisions with respect to other named executive officers, the Compensation
Committee may consider factors such as the individual’s responsibilities, the individual’s performance, industry
experience, current pay mix, total compensation competitiveness, long-term equity and cash awards previously
granted to the individual, retention considerations, and other factors.
54