Symantec 2013 Annual Report Download - page 59
Download and view the complete annual report
Please find page 59 of the 2013 Symantec annual report below. You can navigate through the pages in the report by either clicking on the pages listed below, or by using the keyword search tool below to find specific information within the annual report.-
 1
1 -
2
-
3
-
4
-
5
-
6
-
7
-
8
-
9
-
10
-
11
-
12
-
13
-
14
-
15
-
16
-
17
-
18
-
19
-
20
-
21
-
22
-
23
-
24
-
25
-
26
-
27
-
28
-
29
-
30
-
31
-
32
-
33
-
34
-
35
-
36
-
37
-
38
-
39
-
40
-
41
-
42
-
43
-
44
-
45
-
46
-
47
-
48
-
 49
49 -
 50
50 -
 51
51 -
 52
52 -
 53
53 -
 54
54 -
 55
55 -
 56
56 -
 57
57 -
 58
58 -
 59
59 -
 60
60 -
 61
61 -
 62
62 -
 63
63 -
 64
64 -
 65
65 -
 66
66 -
 67
67 -
 68
68 -
 69
69 -
70
-
71
-
72
-
73
-
74
-
75
-
76
-
77
-
78
-
79
-
80
-
81
-
82
-
83
-
84
-
85
-
86
-
87
-
88
-
89
-
90
-
91
-
92
-
93
-
94
-
95
-
96
-
97
-
98
-
99
-
100
-
101
-
102
-
103
-
104
-
105
-
106
-
107
-
108
-
109
-
110
-
111
-
112
-
113
-
114
-
115
-
116
-
117
-
118
-
119
-
120
-
121
-
122
-
123
-
124
-
125
-
126
-
127
-
128
-
129
-
130
-
131
-
132
-
133
-
134
-
135
-
136
-
137
-
138
-
139
-
140
-
141
-
142
-
143
-
144
-
145
-
146
-
147
-
148
-
149
-
150
-
151
-
152
-
153
-
154
-
155
-
156
-
157
-
158
-
159
-
160
-
161
-
162
-
163
-
164
-
165
-
166
-
167
-
168
-
169
-
170
-
171
-
172
-
173
-
174
-
175
-
176
-
177
-
178
-
179
-
180
-
181
-
182
-
183
-
184
-
185
-
186
-
187
-
188
-
189
-
190
-
191
-
192
-
193
-
194
-
195
-
196
-
197
-
198
-
199
-
200
-
201
-
202
-
203
-
204
 |
 |

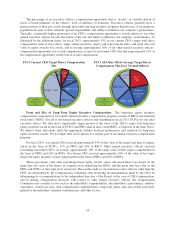
compensation program, we also used two other metrics that more directly align the interests of our executive
officers to those our stockholders: our stock price and the total stockholder return (“TSR”) ranking for our com-
pany as compared to the S&P 500. In addition, individual performance metrics were a factor in the bonus awards
of our named executive officers, other than our CEO, under our Executive Annual Incentive Plan. Our non-
GAAP EPS was well above our targeted level of performance for the full fiscal year, while revenue came in
slightly below our target level. Our cash flow from operations was below our threshold level of performance for
fiscal 2013, which resulted in a zero payout under our FY13 LTIP. Consistent with the presentation in our quar-
terly earnings releases, under our executive compensation programs, we define non-GAAP EPS as diluted net
income per share as adjusted to exclude stock-based compensation expense, restructuring and transition charges,
charges related to the amortization of intangible assets, non-cash interest expense, value-added tax refunds of a
tax from the China tax bureau, certain other tax benefits, and the related tax impact of these adjustments.
Highlights of NEO Compensation
Our named executive officers were compensated in a manner consistent with our core pay-for-performance
compensation philosophy as well as with the terms of our compensation arrangements with them. The following
are highlights of our named executive officers’ compensation for fiscal 2013 and are discussed in greater detail in
this CD&A:
‰For fiscal 2013, approximately 93% of our current CEO’s target total direct compensation was at risk and
approximately 78% of the target total direct compensation for our other named executive officers, on
average, was at risk.
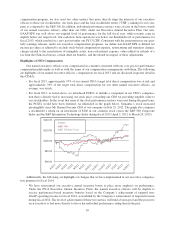
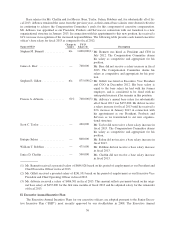
‰For fiscal 2013, as noted above, we introduced PCSUs to include a component in our CEO’s compensa-
tion that is directly tied to increasing our stock price, rewarding our CEO for providing tangible value to
our stockholders. In the event that none of the stock performance metrics were met during the grant term,
the PCSUs would have been forfeited. As illustrated in the graph below, Symantec’s stock increased
meaningfully since Mr. Bennett became CEO of our company on July 25, 2012. The graph also compares
a stockholder’s return on an investment of $100 in our common stock versus the S&P 500 Composite
Index and the S&P Information Technology Index during fiscal 2013 (April 2, 2012 to March 29, 2013):
$140.00
$120.00
$100.00
$80.00
$60.00
4/2/12
5/2/12
6/2/12
7/2/12
8/2/12
9/2/12
10/2/12
11/2/12
12/2/12
1/2/13
2/2/13
3/2/13
3/29/13
- SYMC
- S&P 500
- S&P 500 Info Tech
Additionally, the following are highlights of changes that we have implemented in our executive compensa-
tion program for fiscal 2014:
‰We have restructured our executive annual incentive bonus to place more emphasis on performance.
Under the FY14 Executive Annual Incentive Plans, the named executive officers will be eligible to
receive performance-based incentive bonuses based on the Company’s achievement of targeted non-
GAAP operating income for fiscal 2014, as modified by the Company’s achievement of targeted revenue
during fiscal 2014. The level of achievement of these two metrics will fund a bonus pool and the payout to
each executive is tied more directly to his or her individual performance rating than in the past.
49