Symantec 2013 Annual Report Download - page 169
Download and view the complete annual report
Please find page 169 of the 2013 Symantec annual report below. You can navigate through the pages in the report by either clicking on the pages listed below, or by using the keyword search tool below to find specific information within the annual report.-
 1
1 -
2
-
3
-
4
-
5
-
6
-
7
-
8
-
9
-
10
-
11
-
12
-
13
-
14
-
15
-
16
-
17
-
18
-
19
-
20
-
21
-
22
-
23
-
24
-
25
-
26
-
27
-
28
-
29
-
30
-
31
-
32
-
33
-
34
-
35
-
36
-
37
-
38
-
39
-
40
-
41
-
42
-
43
-
44
-
45
-
46
-
47
-
48
-
49
-
50
-
51
-
52
-
53
-
54
-
55
-
56
-
57
-
58
-
59
-
60
-
61
-
62
-
63
-
64
-
65
-
66
-
67
-
68
-
69
-
70
-
71
-
72
-
73
-
74
-
75
-
76
-
77
-
78
-
79
-
80
-
81
-
82
-
83
-
84
-
85
-
86
-
87
-
88
-
89
-
90
-
91
-
92
-
93
-
94
-
95
-
96
-
97
-
98
-
99
-
100
-
101
-
102
-
103
-
104
-
105
-
106
-
107
-
108
-
109
-
110
-
111
-
112
-
113
-
114
-
115
-
116
-
117
-
118
-
119
-
120
-
121
-
122
-
123
-
124
-
125
-
126
-
127
-
128
-
129
-
130
-
131
-
132
-
133
-
134
-
135
-
136
-
137
-
138
-
139
-
140
-
141
-
142
-
143
-
144
-
145
-
146
-
147
-
148
-
149
-
150
-
151
-
152
-
153
-
154
-
155
-
156
-
157
-
158
-
 159
159 -
 160
160 -
 161
161 -
 162
162 -
 163
163 -
 164
164 -
 165
165 -
 166
166 -
 167
167 -
 168
168 -
 169
169 -
 170
170 -
 171
171 -
 172
172 -
 173
173 -
 174
174 -
 175
175 -
 176
176 -
 177
177 -
 178
178 -
 179
179 -
180
-
181
-
182
-
183
-
184
-
185
-
186
-
187
-
188
-
189
-
190
-
191
-
192
-
193
-
194
-
195
-
196
-
197
-
198
-
199
-
200
-
201
-
202
-
203
-
204
 |
 |

SYMANTEC CORPORATION
Notes to Consolidated Financial Statements — (Continued)
The following table summarizes property and equipment, net of accumulated depreciation by categories for
the periods presented:
As of
March 29,
2013
March 30,
2012
(In millions)
Computer hardware and software .................................... $1,820 $ 1,640
Office furniture and equipment ...................................... 172 176
Buildings ....................................................... 530 489
Leasehold improvements .......................................... 310 284
2,832 2,589
Less: accumulated depreciation ..................................... (1,853) (1,663)
979 926
Construction in progress ......................................... 64 95
Land ......................................................... 79 79
Property and equipment, net .................................... $1,122 $ 1,100
Depreciation expense was $283 million, $273 million, and $257 million in fiscal 2013, 2012, and 2011,
respectively.
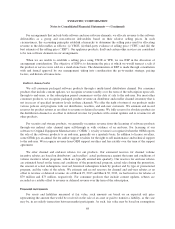
Business combinations
We use the acquisition method of accounting under the authoritative guidance on business combinations.
Each acquired company’s operating results are included in our consolidated financial statements starting on the
date of acquisition. The purchase price is equivalent to the fair value of consideration transferred. Tangible and
identifiable intangible assets acquired and liabilities assumed as of the date of acquisition are recorded at the
acquisition date fair value. Goodwill is recognized for the excess of purchase price over the net fair value of
assets acquired and liabilities assumed.
Amounts allocated to assets and liabilities are based upon fair values. Such valuations require management
to make significant estimates and assumptions, especially with respect to the identifiable intangible assets.
Management makes estimates of fair value based upon assumptions believed to be reasonable and that of a
market participant. These estimates are based on historical experience and information obtained from the
management of the acquired companies and the estimates are inherently uncertain. The separately identifiable
intangible assets generally include developed technology, customer relationships and trade names. We estimate
the fair value of deferred revenue related to product support assumed in connection with acquisitions. The
estimated fair value of deferred revenue is determined by estimating the costs related to fulfilling the obligations
plus a normal profit margin. The estimated costs to fulfill the support contracts are based on the historical direct
costs related to providing the support.
For any given acquisition, we may identify certain pre-acquisition contingencies. We estimate the fair value
of such contingencies, which are included under the acquisition method as part of the assets acquired or liabilities
assumed, as appropriate. Differences from these estimates are recorded in our Consolidated Statements of
Income in the period in which they are identified.
71