Symantec 2013 Annual Report Download - page 137
Download and view the complete annual report
Please find page 137 of the 2013 Symantec annual report below. You can navigate through the pages in the report by either clicking on the pages listed below, or by using the keyword search tool below to find specific information within the annual report.-
 1
1 -
2
-
3
-
4
-
5
-
6
-
7
-
8
-
9
-
10
-
11
-
12
-
13
-
14
-
15
-
16
-
17
-
18
-
19
-
20
-
21
-
22
-
23
-
24
-
25
-
26
-
27
-
28
-
29
-
30
-
31
-
32
-
33
-
34
-
35
-
36
-
37
-
38
-
39
-
40
-
41
-
42
-
43
-
44
-
45
-
46
-
47
-
48
-
49
-
50
-
51
-
52
-
53
-
54
-
55
-
56
-
57
-
58
-
59
-
60
-
61
-
62
-
63
-
64
-
65
-
66
-
67
-
68
-
69
-
70
-
71
-
72
-
73
-
74
-
75
-
76
-
77
-
78
-
79
-
80
-
81
-
82
-
83
-
84
-
85
-
86
-
87
-
88
-
89
-
90
-
91
-
92
-
93
-
94
-
95
-
96
-
97
-
98
-
99
-
100
-
101
-
102
-
103
-
104
-
105
-
106
-
107
-
108
-
109
-
110
-
111
-
112
-
113
-
114
-
115
-
116
-
117
-
118
-
119
-
120
-
121
-
122
-
123
-
124
-
125
-
126
-
 127
127 -
 128
128 -
 129
129 -
 130
130 -
 131
131 -
 132
132 -
 133
133 -
 134
134 -
 135
135 -
 136
136 -
 137
137 -
 138
138 -
 139
139 -
 140
140 -
 141
141 -
 142
142 -
 143
143 -
 144
144 -
 145
145 -
 146
146 -
 147
147 -
148
-
149
-
150
-
151
-
152
-
153
-
154
-
155
-
156
-
157
-
158
-
159
-
160
-
161
-
162
-
163
-
164
-
165
-
166
-
167
-
168
-
169
-
170
-
171
-
172
-
173
-
174
-
175
-
176
-
177
-
178
-
179
-
180
-
181
-
182
-
183
-
184
-
185
-
186
-
187
-
188
-
189
-
190
-
191
-
192
-
193
-
194
-
195
-
196
-
197
-
198
-
199
-
200
-
201
-
202
-
203
-
204
 |
 |

benefit as the largest amount that is more than 50% likely to be realized upon ultimate settlement. We adjust
reserves for our uncertain tax positions due to changing facts and circumstances, such as the closing of a tax
audit, the refinement of estimates, or the realization of earnings or deductions that differ from our estimates. To
the extent that the final outcome of these matters is different than the amounts recorded, such differences will
impact our tax provision in our Consolidated Statements of Income in the period in which such determination is
made.
We must also assess the likelihood that deferred tax assets will be realized from future taxable income and,
based on this assessment establish a valuation allowance, if required. The determination of our valuation
allowance involves assumptions, judgments and estimates, including forecasted earnings, future taxable income,
and the relative proportions of revenue and income before taxes in the various domestic and international
jurisdictions in which we operate. To the extent we establish a valuation allowance or change the valuation
allowance in a period, we reflect the change with a corresponding increase or decrease to our tax provision in our
Consolidated Statements of Income.
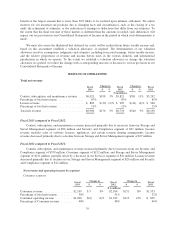
RESULTS OF OPERATIONS
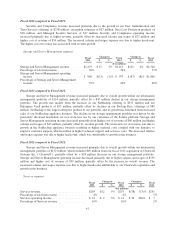
Total net revenue
Fiscal
2013
Change in Fiscal
2012
Change in Fiscal
2011$ % $ %
($ in millions)
Content, subscription, and maintenance revenue .... $6,021 $198 3% $5,823 $581 11% $5,242
Percentage of total net revenue ................. 87% 87% 85%
License revenue ............................. $ 885 $(22) (2)% $ 907 $ (41) (4)% $ 948
Percentage of total net revenue ................. 13% 13% 15%
Total net revenue ............................ $6,906 $176 3% $6,730 $540 9% $6,190
Fiscal 2013 compared to Fiscal 2012:
Content, subscription, and maintenance revenue increased primarily due to increases from our Storage and
Server Management segment of $94 million and Security and Compliance segment of $91 million. License
revenue includes sales of software licenses, appliances, and certain revenue sharing arrangements. License
revenue decreased primarily due to a decline from our Storage and Server Management segment of $27 million.
Fiscal 2012 compared to Fiscal 2011:
Content, subscription, and maintenance revenue increased primarily due to increases from our Security and
Compliance segment of $339 million, Consumer segment of $152 million, and Storage and Server Management
segment of $131 million, partially offset by a decrease in our Services segment of $41 million. License revenue
decreased primarily due to declines in our Storage and Server Management segment of $29 million and Security
and Compliance segment of $12 million.
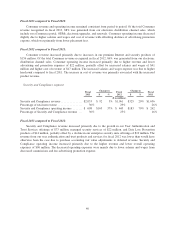
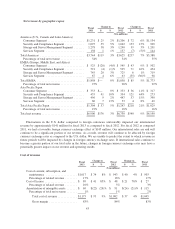
Net revenue and operating income by segment
Consumer segment
Fiscal
2013
Change in Fiscal
2012
Change in Fiscal
2011$ % $ %
($ in millions)
Consumer revenue .................... $2,109 $ 5 0% $2,104 $151 8% $1,953
Percentage of total net revenue .......... 30% 31% 32%
Consumer operating income ............ $1,006 $(6) (1)% $1,012 $113 13% $ 899
Percentage of Consumer revenue ........ 48% 48% 46%
39