Symantec 2013 Annual Report Download - page 143
Download and view the complete annual report
Please find page 143 of the 2013 Symantec annual report below. You can navigate through the pages in the report by either clicking on the pages listed below, or by using the keyword search tool below to find specific information within the annual report.-
 1
1 -
2
-
3
-
4
-
5
-
6
-
7
-
8
-
9
-
10
-
11
-
12
-
13
-
14
-
15
-
16
-
17
-
18
-
19
-
20
-
21
-
22
-
23
-
24
-
25
-
26
-
27
-
28
-
29
-
30
-
31
-
32
-
33
-
34
-
35
-
36
-
37
-
38
-
39
-
40
-
41
-
42
-
43
-
44
-
45
-
46
-
47
-
48
-
49
-
50
-
51
-
52
-
53
-
54
-
55
-
56
-
57
-
58
-
59
-
60
-
61
-
62
-
63
-
64
-
65
-
66
-
67
-
68
-
69
-
70
-
71
-
72
-
73
-
74
-
75
-
76
-
77
-
78
-
79
-
80
-
81
-
82
-
83
-
84
-
85
-
86
-
87
-
88
-
89
-
90
-
91
-
92
-
93
-
94
-
95
-
96
-
97
-
98
-
99
-
100
-
101
-
102
-
103
-
104
-
105
-
106
-
107
-
108
-
109
-
110
-
111
-
112
-
113
-
114
-
115
-
116
-
117
-
118
-
119
-
120
-
121
-
122
-
123
-
124
-
125
-
126
-
127
-
128
-
129
-
130
-
131
-
132
-
 133
133 -
 134
134 -
 135
135 -
 136
136 -
 137
137 -
 138
138 -
 139
139 -
 140
140 -
 141
141 -
 142
142 -
 143
143 -
 144
144 -
 145
145 -
 146
146 -
 147
147 -
 148
148 -
 149
149 -
 150
150 -
 151
151 -
 152
152 -
 153
153 -
154
-
155
-
156
-
157
-
158
-
159
-
160
-
161
-
162
-
163
-
164
-
165
-
166
-
167
-
168
-
169
-
170
-
171
-
172
-
173
-
174
-
175
-
176
-
177
-
178
-
179
-
180
-
181
-
182
-
183
-
184
-
185
-
186
-
187
-
188
-
189
-
190
-
191
-
192
-
193
-
194
-
195
-
196
-
197
-
198
-
199
-
200
-
201
-
202
-
203
-
204
 |
 |
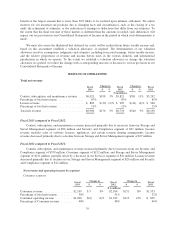
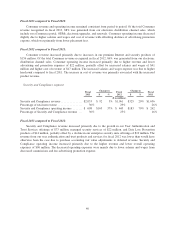
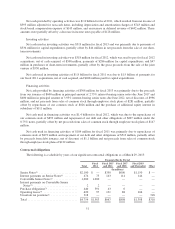
Fiscal 2013 compared to Fiscal 2012:
Sales and marketing expense decreased primarily due to lower advertising and promotional expenses of $73
million, which was attributable to lower placement fees. Research and development expense increased due to
higher salaries and wages expenses of $36 million, which was attributable to increased headcount to support our
continued investment in product development. General and administrative expense remained relatively
consistent.
Intangible assets are comprised of customer relationships and trade names. Amortization of intangible assets
remained consistent.
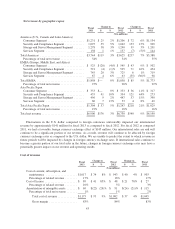
Restructuring and transition costs consist of severance, facilities, transition and other related costs. For fiscal
2013, we recognized $114 million of transition and other related costs, $10 million of severance, and $1 million
of facilities costs. Transition and other related costs consist of severance costs associated with acquisition
integrations and consulting charges associated with the planning and design phase of a new enterprise resource
planning system. In the fourth quarter of fiscal 2013, we announced our strategic direction to focus on key
strategic customer offerings and simplify our GTM strategy and organizational structure. In order to deliver on
this focus, we initiated a restructuring plan to reduce the layers of management and redundant personnel resulting
in headcount reductions across the company beginning in the fourth quarter of fiscal 2013. This plan is expected
to be completed in fiscal 2014 and we expect to incur significant restructuring charges thereunder. For further
information on restructuring and transition costs, see Note 7 of the Notes to Consolidated Financial Statements in
this annual report.
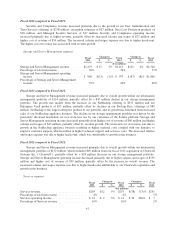
Fiscal 2012 compared to Fiscal 2011:
Sales and marketing expense increased due to increased salaries and wages of $140 million, which was
attributable to increased headcount to support the growth of our business. Research and development expense
increased primarily due to increased salaries and wages of $104 million, which was attributable to increased
headcount to support our continued investment in product development and absorption of the Clearwell
acquisition into our operations. General and administrative expense increased due to higher salaries and wages,
external professional services, and equipment expenses of $45 million.
Amortization of intangible assets increased primarily due to the acquisition of Clearwell.
For fiscal 2012, we recognized restructuring and transition costs of $29 million for severance, $19 million of
transition and other related costs, and $8 million of facilities costs. The transition charges incurred were primarily
due to the planning and design phase of implementing a new enterprise resource planning system. For fiscal
2011, we recognized $47 million of severance, $27 million of facilities costs, and $18 million of transition and
other related costs.
For fiscal 2012 and 2011, we recorded impairment charges of $4 million and $27 million, respectively,
which reduced the gross carrying value of indefinite-lived trade names.
45