Symantec 2013 Annual Report Download - page 85
Download and view the complete annual report
Please find page 85 of the 2013 Symantec annual report below. You can navigate through the pages in the report by either clicking on the pages listed below, or by using the keyword search tool below to find specific information within the annual report.-
 1
1 -
2
-
3
-
4
-
5
-
6
-
7
-
8
-
9
-
10
-
11
-
12
-
13
-
14
-
15
-
16
-
17
-
18
-
19
-
20
-
21
-
22
-
23
-
24
-
25
-
26
-
27
-
28
-
29
-
30
-
31
-
32
-
33
-
34
-
35
-
36
-
37
-
38
-
39
-
40
-
41
-
42
-
43
-
44
-
45
-
46
-
47
-
48
-
49
-
50
-
51
-
52
-
53
-
54
-
55
-
56
-
57
-
58
-
59
-
60
-
61
-
62
-
63
-
64
-
65
-
66
-
67
-
68
-
69
-
70
-
71
-
72
-
73
-
74
-
 75
75 -
 76
76 -
 77
77 -
 78
78 -
 79
79 -
 80
80 -
 81
81 -
 82
82 -
 83
83 -
 84
84 -
 85
85 -
 86
86 -
 87
87 -
 88
88 -
 89
89 -
 90
90 -
 91
91 -
 92
92 -
 93
93 -
 94
94 -
 95
95 -
96
-
97
-
98
-
99
-
100
-
101
-
102
-
103
-
104
-
105
-
106
-
107
-
108
-
109
-
110
-
111
-
112
-
113
-
114
-
115
-
116
-
117
-
118
-
119
-
120
-
121
-
122
-
123
-
124
-
125
-
126
-
127
-
128
-
129
-
130
-
131
-
132
-
133
-
134
-
135
-
136
-
137
-
138
-
139
-
140
-
141
-
142
-
143
-
144
-
145
-
146
-
147
-
148
-
149
-
150
-
151
-
152
-
153
-
154
-
155
-
156
-
157
-
158
-
159
-
160
-
161
-
162
-
163
-
164
-
165
-
166
-
167
-
168
-
169
-
170
-
171
-
172
-
173
-
174
-
175
-
176
-
177
-
178
-
179
-
180
-
181
-
182
-
183
-
184
-
185
-
186
-
187
-
188
-
189
-
190
-
191
-
192
-
193
-
194
-
195
-
196
-
197
-
198
-
199
-
200
-
201
-
202
-
203
-
204
 |
 |

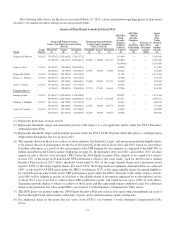
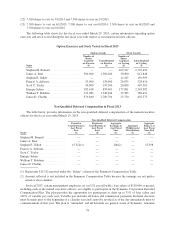
The following table shows for the fiscal year ended March 29, 2013, certain information regarding grants of plan-based
awards to our named executive officers from our incentive plans:
Grants of Plan-Based Awards in Fiscal 2013
Estimated Future Payouts
Under Non-Equity Incentive Plan
Awards
Estimated Future Payouts
Under Equity Incentive
Plan Awards(4)
All Other
Stock
Awards:
Number
of Shares
of Stock
or Units(5)
(#)
All Other
Option
Awards:
Number
of
Securities
Underlying
Options
(#)
Exercise or
Base Price
of Option
Awards
($/Sh)
Grant
Date
Fair
Value
of Stock
and
Option
Awards
($)
Grant
Date(1)
Threshold
($)
Target
($)
Maximum
($)
Threshold
(#)
Target
(#)
Maximum
(#)Name
Stephen M. Bennett .... 9/10/12 739,979(2) 1,020,661(2) 1,786,157(2) 115,000 — — 2,180,400
127,583(3) 510,331(3) 1,020,661(3) 80,000 115,000 229,425 115,000 — — 2,410,400
450,000(6) 6,156,000
James A. Beer ........ 5/10/12 423,500(2) 700,000(2) 1,225,000(2) 40,000 — — 621,200
106,250(3) 425,00(3) 850,000(3) 20,000 40,000 79,800 40,000 664,000
Stephen E. Gillett ...... 1/10/13 178,646(2) 295,282(2) 516,744(2) 51,229 — — 1,021,506
Francis A. deSouza .... 5/10/12 289,237(2) 478,077(2) 836,635(2) 50,000 — — 776,500
106,250(3) 425,000(3) 850,000(3) 25,000 50,000 99,750 50,000 830,000
Scott C. Taylor ........ 5/10/12 165,165(2) 273,000(2) 477,750(2) 27,500 — — 427,075
87,500(3) 350,000(3) 700,000(3) 13,750 27,500 54,863 27,500 456,500
Former Officers
Enrique Salem ........ 5/10/12 870,000(2) 1,200,000(2) 2,100,000(2) 102,857 — — 1,597,369
500,000(3) 2,000,000(3) 4,000,000(3) 88,571 177,143 353,400 177,143 2,940,574
William T. Robbins .... 5/10/12 301,744(2) 498,750(2) 872,813(2) 45,000 — — 698,850
106,250(3) 425,000(3) 850,000(3) 22,500 45,000 89,775 45,000 747,000
Janice D. Chaffin ...... 5/10/12 287,375(2) 475,000(2) 831,250(2) 30,000 — — 465,900
106,250(3) 425,000(3) 850,000(3) 15,000 30,000 59,850 30,000 498,000
(1) Represents grant date of stock awards.
(2) Represents threshold, target and maximum payouts with respect to each applicable metric under the FY13 Executive
Annual Incentive Plan.
(3) Represents threshold, target and maximum payouts under the FY13 LTIP. Payment under this plan is contingent upon
employment through the last day of fiscal 2015.
(4) The amounts shown in these rows reflect, in share amounts, the threshold, target, and maximum potential eligible shares
to be earned (based on performance for the fiscal 2013 period) at the end of fiscal 2014 and 2015, based on, and subject
to further adjustment as a result of, the achievement of the TSR ranking for our company as compared to the S&P 500, as
further described in the CD&A section beginning on page 62. In September 2012 our CEO, and in May 2012 all other
named executive officers, were awarded a PRU under the 2004 Equity Incentive Plan, eligible to be earned if we achieve
at least 70% of the target level non-GAAP EPS performance which is the same metric used for the Executive Annual
Incentive Plan for fiscal 2013, with a threshold award equal to 50% of the target eligible shares and a maximum award
equal to 200% of the target eligible shares. For fiscal 2013, the Compensation Committee determined that we achieved
108% of our non-GAAP EPS target under the PRUs, resulting in 112% of the target eligible shares becoming eligible to
be earned based on achievement of the TSR performance goals under the PRUs. Pursuant to the terms of these awards,
each NEO will be eligible to receive at least half of the eligible shares if he remains employed by us through the last day
of fiscal 2015 even if we fail to achieve those TSR performance goals, and could receive up to 150% of such shares,
depending upon the degree to which we achieve of those goals and the same employment condition is met. For additional
detail on the grant date fair value of the PRUs, see footnote 4 to the Summary Compensation Table above.
(5) This RSU grant was granted under the 2004 Equity Incentive Plan and vests in four equal annual installments on each of
the first through fourth anniversaries of the date of grant, and is settled in shares on the vesting date.
(6) For additional detail on the grant date fair value of the PCSUs, see footnote 5 to the Summary Compensation Table
above.
75