Symantec 2013 Annual Report Download - page 80
Download and view the complete annual report
Please find page 80 of the 2013 Symantec annual report below. You can navigate through the pages in the report by either clicking on the pages listed below, or by using the keyword search tool below to find specific information within the annual report.-
 1
1 -
2
-
3
-
4
-
5
-
6
-
7
-
8
-
9
-
10
-
11
-
12
-
13
-
14
-
15
-
16
-
17
-
18
-
19
-
20
-
21
-
22
-
23
-
24
-
25
-
26
-
27
-
28
-
29
-
30
-
31
-
32
-
33
-
34
-
35
-
36
-
37
-
38
-
39
-
40
-
41
-
42
-
43
-
44
-
45
-
46
-
47
-
48
-
49
-
50
-
51
-
52
-
53
-
54
-
55
-
56
-
57
-
58
-
59
-
60
-
61
-
62
-
63
-
64
-
65
-
66
-
67
-
68
-
69
-
 70
70 -
 71
71 -
 72
72 -
 73
73 -
 74
74 -
 75
75 -
 76
76 -
 77
77 -
 78
78 -
 79
79 -
 80
80 -
 81
81 -
 82
82 -
 83
83 -
 84
84 -
 85
85 -
 86
86 -
 87
87 -
 88
88 -
 89
89 -
 90
90 -
91
-
92
-
93
-
94
-
95
-
96
-
97
-
98
-
99
-
100
-
101
-
102
-
103
-
104
-
105
-
106
-
107
-
108
-
109
-
110
-
111
-
112
-
113
-
114
-
115
-
116
-
117
-
118
-
119
-
120
-
121
-
122
-
123
-
124
-
125
-
126
-
127
-
128
-
129
-
130
-
131
-
132
-
133
-
134
-
135
-
136
-
137
-
138
-
139
-
140
-
141
-
142
-
143
-
144
-
145
-
146
-
147
-
148
-
149
-
150
-
151
-
152
-
153
-
154
-
155
-
156
-
157
-
158
-
159
-
160
-
161
-
162
-
163
-
164
-
165
-
166
-
167
-
168
-
169
-
170
-
171
-
172
-
173
-
174
-
175
-
176
-
177
-
178
-
179
-
180
-
181
-
182
-
183
-
184
-
185
-
186
-
187
-
188
-
189
-
190
-
191
-
192
-
193
-
194
-
195
-
196
-
197
-
198
-
199
-
200
-
201
-
202
-
203
-
204
 |
 |

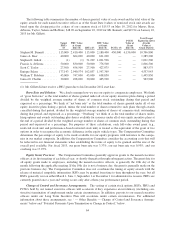
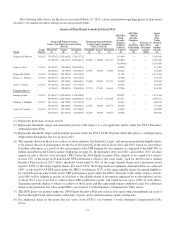
Summary of Compensation
The following table shows for the fiscal year ended March 29, 2013, compensation awarded to or paid to, or
earned by, each individual who served as our Chief Executive Officer during fiscal 2013, our Chief Financial Officer,
the three most highly compensated executive officers who were serving as executive officers (other than as our Chief
Executive Officer or Chief Financial Officer) at the end of fiscal 2013 and two former executive officers who would
have been among our most highly compensated executive officers had they remained an executive officer through the
end of the fiscal year (the “named executive officers”).
Summary Compensation Table for Fiscal 2013
Name and Principal Position
Fiscal
Year
Salary
($)
Bonus
($)
Stock
Awards
($)(1)
Option
Awards
($)(2)
Non-Equity
Incentive Plan
Compensation
($)
All Other
Compensation
($)
Total
($)
Stephen M. Bennett ................. 2013 684,028(3) — 10,746,800(4)(5) — 1,173,760(6) 392,000(7) 12,996,588
President and Chief Executive Officer
James A. Beer ..................... 2013 700,000 — 1,285,200(4) — 710,500(6) 20,372(8) 2,716,072
Executive Vice President, 2012 700,000 — 2,629,000 — 1,111,250(9) 99,556(10) 4,539,806
Chief Financial Officer 2011 700,000 — 505,400 398,060 1,117,050(11) 19,632(12) 2,740,142
Stephen E. Gillett .................. 2013 241,951(13) 3,865,000(14) 1,021,506 — 321,858(6) 270,000(15) 5,720,315
Executive Vice President and
Chief Operating Officer*
Francis A. deSouza ................. 2013 486,301(16) — 1,606,500(4) — 521,104(6) 10,740(17) 2,624,645
President, Products & Services 2012 435,000 — 3,509,200 — 794,250(18) 62,822(19) 4,801,272
Scott C. Taylor .................... 2013 420,000 — 883,575(4) — 289,380(6) 14,599(20) 1,607,554
Executive Vice President,
General Counsel and Corporate
Secretary
Former Officers
Enrique Salem ..................... 2013 262,009(21) — 4,537,943(4) — 3,344,444(22) 2,700,000(23) 10,844,396
Former President and Chief
Executive Officer 2012 800,000 — 5,280,000 — 3,210,000(24) 98,462(25) 9,388,462
2011 750,000 — 1,732,800 1,711,658 4,281,250(26) 33,975(27) 8,509,683
William T. Robbins ................. 2013 356,250(28) — 1,445,850(4) — 686,563(29) 520,114(30) 3,008,777
Former Executive Vice President,
Worldwide Sales and Services 2012 475,000 — 2,629,000 — 904,269(31) 69,946(32) 4,078,215
2011 475,000 — 361,000 238,836 875,400(33) 35,427(34) 1,985,663
Janice D. Chaffin .................. 2013 500,000 — 963,900(4) — 793,875(35) 542,420(36) 2,800,195
Former Group President,
Consumer Business Unit 2012 500,000 — 1,244,400 — 885,625(37) 85,431(38) 2,715,456
2011 500,000 — 505,400 398,060 890,250(39) 60,631(40) 2,354,341
(1) Amounts shown in this column reflect the aggregate full grant date fair value calculated in accordance with FASB
Accounting Standards Codification (“FASC”) Topic 718 for restricted stock unit awards in fiscal years 2011-
2013, PRUs in fiscal years 2012-2013 and, solely in the case of Mr. Bennett in fiscal 2013, PCSUs, each awarded
under Symantec’s 2004 Equity Incentive Plan. Mr. Gillett was not awarded PRUs in fiscal 2013 due to his
December 2012 start date. The grant date fair values for RSUs were determined based on the closing share price
of our common stock on the date of grant. For a discussion of the valuation methodology used to value the PRUs
during fiscal 2012 and 2013 and PCSUs awarded during fiscal 2013, see footnote 4 and 5, respectively, to the
Summary Compensation Table below.
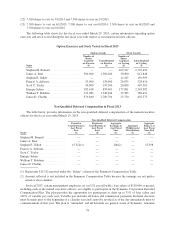
(2) Amounts shown in this column reflect the aggregate full grant date fair value calculated in accordance with FASC
Topic 718 for option awards granted under Symantec’s 2004 Equity Incentive Plan. We calculate the grant date
fair value of stock options using the Black-Scholes option pricing model. The following table includes the
assumptions used to calculate the aggregate grant date fair value of awards reported for fiscal 2011. The assump-
tions listed below are consistent with the assumptions that we used to report stock option valuations and expense
in the consolidated financial statements contained in our annual report on Form 10-K for fiscal year 2013:
Grant Date Volatility (%)
Expected
Life (Years)
Risk-Free
Interest Rate (%)
6/10/2010 .......................................... 34.02 3.51 1.93
(3) Mr. Bennett received a prorated salary of $684,028 based on his period of employment as our President and Chief
Executive Officer in fiscal 2013.
70