Symantec 2013 Annual Report Download - page 81
Download and view the complete annual report
Please find page 81 of the 2013 Symantec annual report below. You can navigate through the pages in the report by either clicking on the pages listed below, or by using the keyword search tool below to find specific information within the annual report.-
 1
1 -
2
-
3
-
4
-
5
-
6
-
7
-
8
-
9
-
10
-
11
-
12
-
13
-
14
-
15
-
16
-
17
-
18
-
19
-
20
-
21
-
22
-
23
-
24
-
25
-
26
-
27
-
28
-
29
-
30
-
31
-
32
-
33
-
34
-
35
-
36
-
37
-
38
-
39
-
40
-
41
-
42
-
43
-
44
-
45
-
46
-
47
-
48
-
49
-
50
-
51
-
52
-
53
-
54
-
55
-
56
-
57
-
58
-
59
-
60
-
61
-
62
-
63
-
64
-
65
-
66
-
67
-
68
-
69
-
70
-
 71
71 -
 72
72 -
 73
73 -
 74
74 -
 75
75 -
 76
76 -
 77
77 -
 78
78 -
 79
79 -
 80
80 -
 81
81 -
 82
82 -
 83
83 -
 84
84 -
 85
85 -
 86
86 -
 87
87 -
 88
88 -
 89
89 -
 90
90 -
 91
91 -
92
-
93
-
94
-
95
-
96
-
97
-
98
-
99
-
100
-
101
-
102
-
103
-
104
-
105
-
106
-
107
-
108
-
109
-
110
-
111
-
112
-
113
-
114
-
115
-
116
-
117
-
118
-
119
-
120
-
121
-
122
-
123
-
124
-
125
-
126
-
127
-
128
-
129
-
130
-
131
-
132
-
133
-
134
-
135
-
136
-
137
-
138
-
139
-
140
-
141
-
142
-
143
-
144
-
145
-
146
-
147
-
148
-
149
-
150
-
151
-
152
-
153
-
154
-
155
-
156
-
157
-
158
-
159
-
160
-
161
-
162
-
163
-
164
-
165
-
166
-
167
-
168
-
169
-
170
-
171
-
172
-
173
-
174
-
175
-
176
-
177
-
178
-
179
-
180
-
181
-
182
-
183
-
184
-
185
-
186
-
187
-
188
-
189
-
190
-
191
-
192
-
193
-
194
-
195
-
196
-
197
-
198
-
199
-
200
-
201
-
202
-
203
-
204
 |
 |

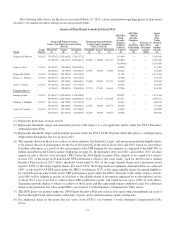
(4) The PRUs awarded in fiscal 2012 and 2013 are based on a three-year performance period. The PRUs are
eligible to be earned if we achieve at least 70% of the target level non-GAAP EPS performance which is the
same metric used for the Executive Annual Incentive Plan for fiscal 2013. Depending on our achievement
of this metric, 0% to 133% of the target shares will be eligible to be earned at the end of the fiscal year of
grant, based on, and subject to further adjustment as a result of, the achievement of the TSR ranking for our
company as compared to the S&P 500 (the market-related component) in the subsequent fiscal years. If any
target shares become eligible (the “eligible shares”) to be earned at the end of the fiscal year of grant as a
result of achievement of the performance-related component, then 50% to 150% of one-half of the eligible
shares may be earned based on the achievement of the TSR goal for the first and second fiscal years and
50% to 150% of one-half of the eligible shares (plus any eligible shares not earned at the end of the second
fiscal year if less than 100% of the TSR goal is achieved for the two-year period then ended) may be earned
based on the achievement of the TSR goal for the first, second and third fiscal years. Because the
performance-related component is based on separate measurements of our financial performance only in the
first year of the three-year performance period, FASC Topic 718 requires the grant date fair value to be
calculated at the commencement of the performance period. Consistent with FASC Topic 718, the full grant
date fair value for the market-related component, or the TSR adjustment, for the entire three-year perform-
ance cycle is included in the amounts shown for fiscal 2013 (the year of grant) and was determined using a
Monte Carlo simulation option pricing model (“Monte Carlo model”) on the date the PRUs were awarded
in fiscal 2012 and 2013.
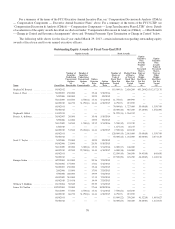
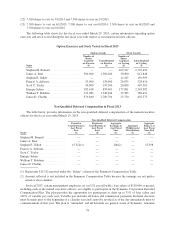
The table below sets forth the grant date fair value determined in accordance with FASC Topic 718 princi-
ples established in fiscal 2012 and 2013 for the performance-related component of these awards (i) based
upon the probable outcome of the fiscal 2012 and 2013 performance-related component as of the grant date,
and (ii) based upon achieving the maximum level of performance under the fiscal 2012 and 2013
performance-related component as of the grant date. Also set forth below are the grant date fair values per-
taining to the market-related component or the TSR adjustment and significant inputs and assumptions used
in the Monte Carlo model, determined upon grant in fiscal 2012 and 2013, and which is not subject to prob-
able or maximum outcome assumptions.
Name
Fiscal
Year
Probable Outcome of
Performance
Conditions Grant
Date Fair Value
($)
Maximum
Outcome of
Performance
Conditions Grant
Date Fair Value
($)
Market-Related
Component Grant
Date Fair Value
($)
Stephen M. Bennett .................... 2013 2,410,400 3,205,832 2,410,400
James A. Beer ........................ 2013 783,520 883,120 664,000
2012 964,000 1,282,120 964,000
Stephen E. Gillett ...................... 2013 — — —
Francis A. deSouza .................... 2013 979,400 1,103,900 830,000
2012 919,200 1,222,536 919,200
Scott C. Taylor ........................ 2013 538,670 607,145 456,500
2012 574,500 764,085 574,500
Enrique Salem ........................ 2013 3,469,877 3,910,963 2,940,573
2012 3,615,000 4,807,950 3,615,000
William T. Robbins .................... 2013 881,460 993,510 747,000
2012 964,000 1,282,120 964,000
Janice D. Chaffin ...................... 2013 587,640 662,340 498,000
2012 689,400 916,902 689,400
Grant Date
Grant Date
Fair Value ($) Volatility (%)
Risk-Free
Interest Rate (%)
5/9/2011 ..................................... 24.10 48.67 0.90
6/10/2011 .................................... 22.98 48.33 0.65
5/10/2012 .................................... 16.60 32.21 0.36
9/10/2012 .................................... 20.96 31.17 0.38
71