Symantec 2013 Annual Report Download - page 188
Download and view the complete annual report
Please find page 188 of the 2013 Symantec annual report below. You can navigate through the pages in the report by either clicking on the pages listed below, or by using the keyword search tool below to find specific information within the annual report.-
 1
1 -
2
-
3
-
4
-
5
-
6
-
7
-
8
-
9
-
10
-
11
-
12
-
13
-
14
-
15
-
16
-
17
-
18
-
19
-
20
-
21
-
22
-
23
-
24
-
25
-
26
-
27
-
28
-
29
-
30
-
31
-
32
-
33
-
34
-
35
-
36
-
37
-
38
-
39
-
40
-
41
-
42
-
43
-
44
-
45
-
46
-
47
-
48
-
49
-
50
-
51
-
52
-
53
-
54
-
55
-
56
-
57
-
58
-
59
-
60
-
61
-
62
-
63
-
64
-
65
-
66
-
67
-
68
-
69
-
70
-
71
-
72
-
73
-
74
-
75
-
76
-
77
-
78
-
79
-
80
-
81
-
82
-
83
-
84
-
85
-
86
-
87
-
88
-
89
-
90
-
91
-
92
-
93
-
94
-
95
-
96
-
97
-
98
-
99
-
100
-
101
-
102
-
103
-
104
-
105
-
106
-
107
-
108
-
109
-
110
-
111
-
112
-
113
-
114
-
115
-
116
-
117
-
118
-
119
-
120
-
121
-
122
-
123
-
124
-
125
-
126
-
127
-
128
-
129
-
130
-
131
-
132
-
133
-
134
-
135
-
136
-
137
-
138
-
139
-
140
-
141
-
142
-
143
-
144
-
145
-
146
-
147
-
148
-
149
-
150
-
151
-
152
-
153
-
154
-
155
-
156
-
157
-
158
-
159
-
160
-
161
-
162
-
163
-
164
-
165
-
166
-
167
-
168
-
169
-
170
-
171
-
172
-
173
-
174
-
175
-
176
-
177
-
 178
178 -
 179
179 -
 180
180 -
 181
181 -
 182
182 -
 183
183 -
 184
184 -
 185
185 -
 186
186 -
 187
187 -
 188
188 -
 189
189 -
 190
190 -
 191
191 -
 192
192 -
 193
193 -
 194
194 -
 195
195 -
 196
196 -
 197
197 -
 198
198 -
199
-
200
-
201
-
202
-
203
-
204
 |
 |

SYMANTEC CORPORATION
Notes to Consolidated Financial Statements — (Continued)
security, data loss prevention, encryption, managed security services, and authentication services. These
solutions allow our customers to secure, provision, and remotely manage their laptops, PCs, mobile
devices, and servers.
•Storage and Server Management: Our Storage and Server Management segment focuses on providing
large, medium, and small-sized businesses with storage and server management, backup, archiving,
eDiscovery, and data protection solutions across heterogeneous storage and server platforms, as well as
solutions delivered through our cloud and appliance offerings.
•Services: Our Services segment provides customers with implementation services and solutions
designed to assist them in maximizing the value of their Symantec software. Our offerings include
consulting, business critical services, and education.
•Other: Our Other segment is comprised of sunset products and products nearing the end of their life
cycle. It may include certain general and administrative expenses, amortization of intangible assets,
impairment of goodwill, intangible assets, and other long-lived assets, stock-based compensation,
restructuring and transition expenses, and certain indirect costs that are not charged to the operating
segments described above, such as interest income and expense.
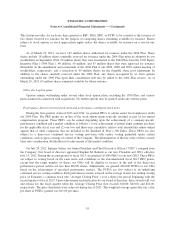
There were no intersegment sales for the periods presented. Our chief operating decision maker evaluates
performance primarily based on net revenue. Except for goodwill, as disclosed in Note 4, the majority of our
assets are not discretely identified by segment.
Consumer
Security
and
Compliance
Storage and
Server
Management Services Other
Total
Company
($ in millions)
Fiscal 2013
Net revenue .......................... $2,109 $2,053 $2,479 $265 $ — $6,906
Percentage of total net revenue ......... 30% 30% 36% 4% 0% 100%
Operating income (loss) ................. 1,006 608 960 43 (1,494) 1,123
Operating margin .................... 48% 30% 39% 16% *
Depreciation, amortization of intangibles,
and amortization of debt issuance and
discounts expense .................... 37 63 31 3 564 698
Fiscal 2012
Net revenue .......................... $2,104 $1,961 $2,412 $253 $ — $6,730
Percentage of total net revenue ......... 31% 29% 36% 4% 0% 100%
Operating income (loss) ................. 1,012 445 973 41 (1,392) 1,079
Operating margin .................... 48% 23% 40% 16% *
Depreciation, amortization of intangibles,
and amortization of debt issuance and
discounts expense .................... 40 56 30 3 583 712
Fiscal 2011
Net revenue .......................... $1,953 $1,636 $2,310 $291 $ — $6,190
Percentage of total net revenue ......... 32% 26% 37% 5% 0% 100%
Operating income (loss) ................. 899 262 1,060 7 (1,348) 880
Operating margin .................... 46% 16% 46% 2% *
Depreciation, amortization of intangibles,
and amortization of debt issuance and
discounts expense .................... 39 42 33 4 625 743
* Percentage not meaningful.
90