Symantec 2013 Annual Report Download - page 131
Download and view the complete annual report
Please find page 131 of the 2013 Symantec annual report below. You can navigate through the pages in the report by either clicking on the pages listed below, or by using the keyword search tool below to find specific information within the annual report.Financial results and trends
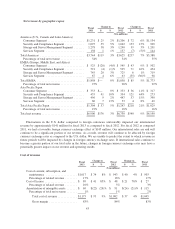
Revenue increased by $176 million for fiscal 2013 as compared to fiscal 2012, primarily driven by growth
in our Security and Compliance and Storage and Server Management segments. Our revenue grew both
domestically and internationally in fiscal 2013 as compared to fiscal 2012. For fiscal 2013, we experienced the
highest growth in revenue, on a percentage basis, in the Asia Pacific and Japan region followed by the Americas.
The EMEA region remained flat despite macroeconomic challenges in the European economy. Fluctuations in
the U.S. dollar compared to foreign currencies unfavorably impacted our international revenue by $141 million
for fiscal 2013 as compared to fiscal 2012.
Cost of revenue increased by $93 million for fiscal 2013 as compared to fiscal 2012, primarily due to our
initiative to improve customer support resulting in higher technical support costs, the increasing costs associated
with major OEM partners as part of certain revenue-sharing arrangements, and the additional direct costs
associated with our appliance business.
Operating expenses remained consistent as a percentage of revenue, while we continued to focus on
investing in product development and increasing compensation costs due to headcount additions coupled with
effectively managing our cost structure. We experienced favorable foreign currency effects on our operating
expenses of $98 million in fiscal 2013 as compared to fiscal 2012. As we continue to reallocate talent within our
organization and are dedicating spending and resources to focus on certain key areas, we expect research and
development expenses to increase through fiscal 2017 as we invest to drive organic innovation for our customers.
Furthermore, we will incur significant restructuring charges as we eliminate duplicative organization and
operating structures. These restructuring activities are expected to be completed in fiscal 2014 and we expect to
incur total severance and benefit costs between $220 million and $250 million.
CRITICAL ACCOUNTING ESTIMATES
The preparation of our Consolidated Financial Statements and related notes included in this annual report in
accordance with generally accepted accounting principles in the United States, requires us to make estimates,
including judgments and assumptions, that affect the reported amounts of assets, liabilities, revenue, and
expenses, and related disclosure of contingent assets and liabilities. We have based our estimates on historical
experience and on various assumptions that we believe to be reasonable under the circumstances. We evaluate
our estimates on a regular basis and make changes accordingly. Historically, our critical accounting estimates
have not differed materially from actual results; however, actual results may differ from these estimates under
different conditions. If actual results differ from these estimates and other considerations used in estimating
amounts reflected in our Consolidated Financial Statements included in this annual report, the resulting changes
could have a material adverse effect on our Consolidated Statements of Income, and in certain situations, could
have a material adverse effect on our liquidity and financial condition.
A critical accounting estimate is based on judgments and assumptions about matters that are uncertain at the
time the estimate is made. Different estimates that reasonably could have been used or changes in accounting
estimates could materially impact our operating results or financial condition. We believe that the estimates
described below represent our critical accounting estimates, as they have the greatest potential impact on our
Consolidated Financial Statements. See also Note 1 of the Notes to Consolidated Financial Statements included
in this annual report.
Revenue recognition
We recognize revenue primarily pursuant to the requirements under the authoritative guidance on software
revenue recognition, and any applicable amendments or modifications. Revenue recognition requirements in the
software industry are very complex and require us to make many estimates.
33


