Symantec 2013 Annual Report Download - page 189
Download and view the complete annual report
Please find page 189 of the 2013 Symantec annual report below. You can navigate through the pages in the report by either clicking on the pages listed below, or by using the keyword search tool below to find specific information within the annual report.-
 1
1 -
2
-
3
-
4
-
5
-
6
-
7
-
8
-
9
-
10
-
11
-
12
-
13
-
14
-
15
-
16
-
17
-
18
-
19
-
20
-
21
-
22
-
23
-
24
-
25
-
26
-
27
-
28
-
29
-
30
-
31
-
32
-
33
-
34
-
35
-
36
-
37
-
38
-
39
-
40
-
41
-
42
-
43
-
44
-
45
-
46
-
47
-
48
-
49
-
50
-
51
-
52
-
53
-
54
-
55
-
56
-
57
-
58
-
59
-
60
-
61
-
62
-
63
-
64
-
65
-
66
-
67
-
68
-
69
-
70
-
71
-
72
-
73
-
74
-
75
-
76
-
77
-
78
-
79
-
80
-
81
-
82
-
83
-
84
-
85
-
86
-
87
-
88
-
89
-
90
-
91
-
92
-
93
-
94
-
95
-
96
-
97
-
98
-
99
-
100
-
101
-
102
-
103
-
104
-
105
-
106
-
107
-
108
-
109
-
110
-
111
-
112
-
113
-
114
-
115
-
116
-
117
-
118
-
119
-
120
-
121
-
122
-
123
-
124
-
125
-
126
-
127
-
128
-
129
-
130
-
131
-
132
-
133
-
134
-
135
-
136
-
137
-
138
-
139
-
140
-
141
-
142
-
143
-
144
-
145
-
146
-
147
-
148
-
149
-
150
-
151
-
152
-
153
-
154
-
155
-
156
-
157
-
158
-
159
-
160
-
161
-
162
-
163
-
164
-
165
-
166
-
167
-
168
-
169
-
170
-
171
-
172
-
173
-
174
-
175
-
176
-
177
-
178
-
 179
179 -
 180
180 -
 181
181 -
 182
182 -
 183
183 -
 184
184 -
 185
185 -
 186
186 -
 187
187 -
 188
188 -
 189
189 -
 190
190 -
 191
191 -
 192
192 -
 193
193 -
 194
194 -
 195
195 -
 196
196 -
 197
197 -
 198
198 -
 199
199 -
200
-
201
-
202
-
203
-
204
 |
 |

SYMANTEC CORPORATION
Notes to Consolidated Financial Statements — (Continued)
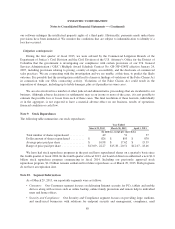
Product revenue information
The following table represents revenue as a percentage of total revenue by significant product categories:
Year Ended
March 29,
2013
March 30,
2012
April 1,
2011
Core consumer security ................................... 27% 28% 28%
Backup ................................................ 21% 20% 21%
Storage and availability management ......................... 8% 9% 10%
Endpoint security and management .......................... 8% 9% 10%
Others (1) ............................................... 36% 34% 31%
Total product revenue ..................................... 100% 100% 100%
(1) No other product category was material to the respective totals.
Geographical Information
The following table represents net revenue amounts recognized for sales in the corresponding countries:
Year Ended
March 29,
2013
March 30,
2012
April 1,
2011
(In millions)
United States ........................................... $3,337 $3,240 $3,056
Foreign countries (1) ...................................... 3,569 3,490 3,134
Total net revenue ........................................ $6,906 $6,730 $6,190
(1) No individual country represented more than 10% of the respective totals.
The table below lists our property and equipment, net of accumulated depreciation, by geographic area.
With the exception of property and equipment, we do not identify or allocate our assets by geographic area:
As of
March 29,
2013
March 30,
2012
April 1,
2011
(In millions)
United States ........................................... $ 903 $ 885 $ 835
Foreign countries (1) ...................................... 219 215 215
Total .................................................. $1,122 $1,100 $1,050
(1) No individual country represented more than 10% of the respective totals.
Significant customers
In fiscal 2013 and 2012, there were no significant customers that accounted for more than 10% of our total
net revenue. In fiscal 2011, one distributor, Ingram Micro, accounted for 10% of our total net revenue. Our
distributor arrangements with Ingram Micro consisted of several non-exclusive, independently negotiated
agreements with its subsidiaries, each of which cover different countries or regions. Each of these agreements
was separately negotiated and was independent of any other contract (such as a master distribution agreement),
and these agreements were not based on the same form of contract.
91