Symantec 2013 Annual Report Download - page 175
Download and view the complete annual report
Please find page 175 of the 2013 Symantec annual report below. You can navigate through the pages in the report by either clicking on the pages listed below, or by using the keyword search tool below to find specific information within the annual report.-
 1
1 -
2
-
3
-
4
-
5
-
6
-
7
-
8
-
9
-
10
-
11
-
12
-
13
-
14
-
15
-
16
-
17
-
18
-
19
-
20
-
21
-
22
-
23
-
24
-
25
-
26
-
27
-
28
-
29
-
30
-
31
-
32
-
33
-
34
-
35
-
36
-
37
-
38
-
39
-
40
-
41
-
42
-
43
-
44
-
45
-
46
-
47
-
48
-
49
-
50
-
51
-
52
-
53
-
54
-
55
-
56
-
57
-
58
-
59
-
60
-
61
-
62
-
63
-
64
-
65
-
66
-
67
-
68
-
69
-
70
-
71
-
72
-
73
-
74
-
75
-
76
-
77
-
78
-
79
-
80
-
81
-
82
-
83
-
84
-
85
-
86
-
87
-
88
-
89
-
90
-
91
-
92
-
93
-
94
-
95
-
96
-
97
-
98
-
99
-
100
-
101
-
102
-
103
-
104
-
105
-
106
-
107
-
108
-
109
-
110
-
111
-
112
-
113
-
114
-
115
-
116
-
117
-
118
-
119
-
120
-
121
-
122
-
123
-
124
-
125
-
126
-
127
-
128
-
129
-
130
-
131
-
132
-
133
-
134
-
135
-
136
-
137
-
138
-
139
-
140
-
141
-
142
-
143
-
144
-
145
-
146
-
147
-
148
-
149
-
150
-
151
-
152
-
153
-
154
-
155
-
156
-
157
-
158
-
159
-
160
-
161
-
162
-
163
-
164
-
 165
165 -
 166
166 -
 167
167 -
 168
168 -
 169
169 -
 170
170 -
 171
171 -
 172
172 -
 173
173 -
 174
174 -
 175
175 -
 176
176 -
 177
177 -
 178
178 -
 179
179 -
 180
180 -
 181
181 -
 182
182 -
 183
183 -
 184
184 -
 185
185 -
186
-
187
-
188
-
189
-
190
-
191
-
192
-
193
-
194
-
195
-
196
-
197
-
198
-
199
-
200
-
201
-
202
-
203
-
204
 |
 |

SYMANTEC CORPORATION
Notes to Consolidated Financial Statements — (Continued)
•Level 3: Unobservable inputs reflecting our own assumptions incorporated in valuation techniques
used to determine fair value. These assumptions are required to be consistent with market participant
assumptions that are reasonably available.
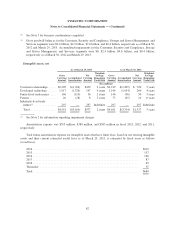
Assets measured and recorded at fair value on a recurring basis
There have been no transfers between fair value measurement levels during fiscal 2013. The following table
summarizes our assets measured at fair value on a recurring basis, by level, within the fair value hierarchy:
As of March 29, 2013 As of March 30, 2012
Level 1 Level 2 Total Level 1 Level 2 Total
(In millions)
Cash equivalents(1) ................................ $3,469 $— $3,469 $1,483 $— $1,483
Marketable equity securities ........................ 62 — 62 5 — 5
(1) Cash equivalents consist of investments with remaining maturities of three months or less at the date of
purchase, or money market funds for which the carrying amount is a reasonable estimate of fair value.
Assets and liabilities measured and recorded at fair value on a nonrecurring basis
Goodwill. In fiscal 2012, we recorded an impairment of $19 million as a cumulative-effect adjustment in
Accumulated deficit, related to an implied fair value measurement made for our Services reporting unit upon the
adoption of a new accounting standard. The valuation technique used to estimate the implied fair value of
goodwill was an income approach which relied upon Level 3 inputs, which included discounted estimated future
cash flows or profit streams.
Indefinite-lived intangible assets. In fiscal 2012 and 2011, we recorded impairment charges of $4 million
and $27 million, respectively, which reduced the gross carrying value of indefinite-lived trade names. The fair
value amounts were derived using an income approach which required Level 3 inputs such as discounted
estimated future cash flows on profit streams. These impairment charges were due to reductions in expected
future cash flows for certain indefinite-lived trade names related to the Security and Compliance segment and the
Consumer segment, respectively. These impairment charges were recorded within Impairment of intangible
assets in our Consolidated Statements of Income.
Debt. In fiscal 2011, we repurchased $500 million of aggregate principal amount of our 0.75% convertible
senior notes, which had a net book value of $481 million. Concurrently with the repurchase, we sold a
proportionate share of the initial note hedges back to the note hedge counterparties for approximately $13
million. These transactions resulted in a loss from extinguishment of debt of approximately $16 million, which
represented the difference between book value of the notes net of the remaining unamortized discount prior to
repurchase and the fair value of the liability component of the notes upon repurchase. The fair value of the
liability component was calculated to be $497 million upon repurchase using Level 2 inputs based on market
prices for similar convertible debt instruments and resulting yields.
Note 3. Business Combinations
Fiscal 2013
On April 2, 2012, we completed the acquisition of a privately-held provider of mobile application
management. In exchange for all of the voting equity interests of the acquired company, we paid a total purchase
price of $28 million in cash. The objective of the acquisition is to extend our enterprise mobility portfolio to
77