Symantec 2013 Annual Report Download - page 193
Download and view the complete annual report
Please find page 193 of the 2013 Symantec annual report below. You can navigate through the pages in the report by either clicking on the pages listed below, or by using the keyword search tool below to find specific information within the annual report.-
 1
1 -
2
-
3
-
4
-
5
-
6
-
7
-
8
-
9
-
10
-
11
-
12
-
13
-
14
-
15
-
16
-
17
-
18
-
19
-
20
-
21
-
22
-
23
-
24
-
25
-
26
-
27
-
28
-
29
-
30
-
31
-
32
-
33
-
34
-
35
-
36
-
37
-
38
-
39
-
40
-
41
-
42
-
43
-
44
-
45
-
46
-
47
-
48
-
49
-
50
-
51
-
52
-
53
-
54
-
55
-
56
-
57
-
58
-
59
-
60
-
61
-
62
-
63
-
64
-
65
-
66
-
67
-
68
-
69
-
70
-
71
-
72
-
73
-
74
-
75
-
76
-
77
-
78
-
79
-
80
-
81
-
82
-
83
-
84
-
85
-
86
-
87
-
88
-
89
-
90
-
91
-
92
-
93
-
94
-
95
-
96
-
97
-
98
-
99
-
100
-
101
-
102
-
103
-
104
-
105
-
106
-
107
-
108
-
109
-
110
-
111
-
112
-
113
-
114
-
115
-
116
-
117
-
118
-
119
-
120
-
121
-
122
-
123
-
124
-
125
-
126
-
127
-
128
-
129
-
130
-
131
-
132
-
133
-
134
-
135
-
136
-
137
-
138
-
139
-
140
-
141
-
142
-
143
-
144
-
145
-
146
-
147
-
148
-
149
-
150
-
151
-
152
-
153
-
154
-
155
-
156
-
157
-
158
-
159
-
160
-
161
-
162
-
163
-
164
-
165
-
166
-
167
-
168
-
169
-
170
-
171
-
172
-
173
-
174
-
175
-
176
-
177
-
178
-
179
-
180
-
181
-
182
-
 183
183 -
 184
184 -
 185
185 -
 186
186 -
 187
187 -
 188
188 -
 189
189 -
 190
190 -
 191
191 -
 192
192 -
 193
193 -
 194
194 -
 195
195 -
 196
196 -
 197
197 -
 198
198 -
 199
199 -
 200
200 -
 201
201 -
 202
202 -
 203
203 -
204
 |
 |

SYMANTEC CORPORATION
Notes to Consolidated Financial Statements — (Continued)
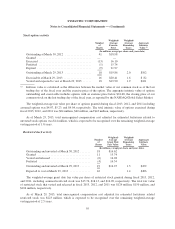
Stock options activity
Number
of
Shares
Weighted-
Average
Exercise
Price
Weighted-
Average
Remaining
Years
Aggregate
Intrinsic
Value (1)
(In millions, except per share and years data)
Outstanding at March 30, 2012 .................. 41 $18.98
Granted ..................................... — —
Exercised .................................... (13) 16.10
Forfeited .................................... (1) 15.74
Expired ..................................... (9) 21.97
Outstanding at March 29, 2013 .................. 18 $19.86 2.0 $102
Exercisable at March 29, 2013 ................... 16 $20.41 1.6 $ 82
Vested and expected to vest at March 29, 2013 ...... 18 $19.90 1.9 $101
(1) Intrinsic value is calculated as the difference between the market value of our common stock as of the last
trading day of the fiscal year and the exercise price of the option. The aggregate intrinsic value of options
outstanding and exercisable includes options with an exercise price below $24.68, the closing price of our
common stock on the last trading day of the fiscal year, as reported by the NASDAQ Global Select Market.
The weighted-average fair value per share of options granted during fiscal 2013, 2012, and 2011 including
assumed options was $4.07, $5.23, and $4.04, respectively. The total intrinsic value of options exercised during
fiscal 2013, 2012, and 2011 was $64 million, $40 million, and $43 million, respectively.
As of March 29, 2013, total unrecognized compensation cost adjusted for estimated forfeitures related to
unvested stock options was $14 million, which is expected to be recognized over the remaining weighted-average
vesting period of 1.8 years.
Restricted stock activity
Number
of
Shares
Weighted-
Average
Grant Date
Fair Value
Weighted-
Average
Remaining
Years
Aggregate
Intrinsic
Value
(In millions, except per share and years data)
Outstanding and unvested at March 30, 2012 ....... 18 $16.62
Granted .................................... 11 15.74
Vested and released ........................... (6) 16.28
Forfeited ................................... (4) 16.34
Outstanding and unvested at March 29, 2013 ....... 19 $16.25 1.5 $472
Expected to vest at March 29, 2013 .............. 16 1.4 $406
The weighted-average grant date fair value per share of restricted stock granted during fiscal 2013, 2012,
and 2011, including assumed restricted stock was $15.74, $18.13, and $14.96, respectively. The total fair value
of restricted stock that vested and released in fiscal 2013, 2012, and 2011 was $124 million, $150 million, and
$104 million, respectively.
As of March 29, 2013, total unrecognized compensation cost adjusted for estimated forfeitures related
restricted stock was $223 million, which is expected to be recognized over the remaining weighted-average
vesting period of 2.5 years.
95