Symantec 2013 Annual Report Download - page 141
Download and view the complete annual report
Please find page 141 of the 2013 Symantec annual report below. You can navigate through the pages in the report by either clicking on the pages listed below, or by using the keyword search tool below to find specific information within the annual report.-
 1
1 -
2
-
3
-
4
-
5
-
6
-
7
-
8
-
9
-
10
-
11
-
12
-
13
-
14
-
15
-
16
-
17
-
18
-
19
-
20
-
21
-
22
-
23
-
24
-
25
-
26
-
27
-
28
-
29
-
30
-
31
-
32
-
33
-
34
-
35
-
36
-
37
-
38
-
39
-
40
-
41
-
42
-
43
-
44
-
45
-
46
-
47
-
48
-
49
-
50
-
51
-
52
-
53
-
54
-
55
-
56
-
57
-
58
-
59
-
60
-
61
-
62
-
63
-
64
-
65
-
66
-
67
-
68
-
69
-
70
-
71
-
72
-
73
-
74
-
75
-
76
-
77
-
78
-
79
-
80
-
81
-
82
-
83
-
84
-
85
-
86
-
87
-
88
-
89
-
90
-
91
-
92
-
93
-
94
-
95
-
96
-
97
-
98
-
99
-
100
-
101
-
102
-
103
-
104
-
105
-
106
-
107
-
108
-
109
-
110
-
111
-
112
-
113
-
114
-
115
-
116
-
117
-
118
-
119
-
120
-
121
-
122
-
123
-
124
-
125
-
126
-
127
-
128
-
129
-
130
-
 131
131 -
 132
132 -
 133
133 -
 134
134 -
 135
135 -
 136
136 -
 137
137 -
 138
138 -
 139
139 -
 140
140 -
 141
141 -
 142
142 -
 143
143 -
 144
144 -
 145
145 -
 146
146 -
 147
147 -
 148
148 -
 149
149 -
 150
150 -
 151
151 -
152
-
153
-
154
-
155
-
156
-
157
-
158
-
159
-
160
-
161
-
162
-
163
-
164
-
165
-
166
-
167
-
168
-
169
-
170
-
171
-
172
-
173
-
174
-
175
-
176
-
177
-
178
-
179
-
180
-
181
-
182
-
183
-
184
-
185
-
186
-
187
-
188
-
189
-
190
-
191
-
192
-
193
-
194
-
195
-
196
-
197
-
198
-
199
-
200
-
201
-
202
-
203
-
204
 |
 |

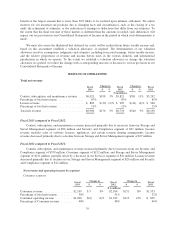
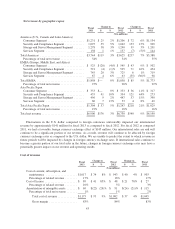
Net revenue by geographic region
Fiscal
2013
Change in Fiscal
2012
Change in Fiscal
2011$ % $ %
($ in millions)
Americas (U.S., Canada and Latin America)
Consumer Segment ......................... $1,231 $ 25 2% $1,206 $ 72 6% $1,134
Security and Compliance Segment ............. 1,097 55 5% 1,042 133 15% 909
Storage and Server Management Segment ....... 1,278 38 3% 1,240 39 3% 1,201
Services Segment .......................... 138 1 1% 137 (7) (5)% 144
Total Americas .............................. $3,744 $119 3% $3,625 $237 7% $3,388
Percentage of total net revenue ................ 54% 54% 55%
EMEA (Europe, Middle East, and Africa)
Consumer Segment ......................... $ 525 $(20) (4)% $ 545 $ 43 9% $ 502
Security and Compliance Segment ............. 521 (4) (1)% 525 71 16% 454
Storage and Server Management Segment ....... 745 20 3% 725 6 1% 719
Services Segment .......................... 67 4 6% 63 (35) (36)% 98
Total EMEA ................................ $1,858 $— 0% $1,858 $ 85 5% $1,773
Percentage of total net revenue ................ 27% 28% 29%
Asia Pacific/Japan
Consumer Segment ......................... $ 353 $— 0% $ 353 $ 36 11% $ 317
Security and Compliance Segment ............. 435 41 10% 394 121 44% 273
Storage and Server Management Segment ....... 456 9 2% 447 57 15% 390
Services Segment .......................... 60 7 13% 53 4 8% 49
Total Asia Pacific/Japan ....................... $1,304 $ 57 5% $1,247 $218 21% $1,029
Percentage of total net revenue ................ 19% 18% 16%
Total net revenue ............................. $6,906 $176 3% $6,730 $540 9% $6,190
Fluctuations in the U.S. dollar compared to foreign currencies unfavorably impacted our international
revenue by approximately $141 million for fiscal 2013 as compared to fiscal 2012. For fiscal 2012 as compared
2011, we had a favorable foreign currency exchange effect of $145 million. Our international sales are and will
continue to be a significant portion of our revenue. As a result, revenue will continue to be affected by foreign
currency exchange rates as compared to the U.S. dollar. We are unable to predict the extent to which revenue in
future periods will be impacted by changes in foreign currency exchange rates. If international sales continue to
become a greater portion of our total sales in the future, changes in foreign currency exchange rates may have a
potentially greater impact on our revenue and operating results.
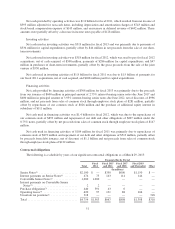
Cost of revenue
Fiscal
2013
Change in Fiscal
2012
Change in Fiscal
2011$ % $ %
($ in millions)
Cost of content, subscription, and
maintenance ..................... $1,017 $ 74 8% $ 943 $ 40 4% $ 903
Percentage of related revenue ........ 17% 16% 17%
Cost of license ...................... $ 89 $41 85% $ 48 $21 78% $ 27
Percentage of related revenue ........ 10% 5% 3%
Amortization of intangible assets ....... $ 69 $(22) (24)% $ 91 $(24) (21)% $ 115
Percentage of total net revenue ....... 1% 1% 2%
Total cost of revenue ............. $1,175 $ 93 9% $1,082 $ 37 4% $1,045
Gross margin ................... 83% 84% 83%
43