Symantec 2013 Annual Report Download - page 69
Download and view the complete annual report
Please find page 69 of the 2013 Symantec annual report below. You can navigate through the pages in the report by either clicking on the pages listed below, or by using the keyword search tool below to find specific information within the annual report.-
 1
1 -
2
-
3
-
4
-
5
-
6
-
7
-
8
-
9
-
10
-
11
-
12
-
13
-
14
-
15
-
16
-
17
-
18
-
19
-
20
-
21
-
22
-
23
-
24
-
25
-
26
-
27
-
28
-
29
-
30
-
31
-
32
-
33
-
34
-
35
-
36
-
37
-
38
-
39
-
40
-
41
-
42
-
43
-
44
-
45
-
46
-
47
-
48
-
49
-
50
-
51
-
52
-
53
-
54
-
55
-
56
-
57
-
58
-
 59
59 -
 60
60 -
 61
61 -
 62
62 -
 63
63 -
 64
64 -
 65
65 -
 66
66 -
 67
67 -
 68
68 -
 69
69 -
 70
70 -
 71
71 -
 72
72 -
 73
73 -
 74
74 -
 75
75 -
 76
76 -
 77
77 -
 78
78 -
 79
79 -
80
-
81
-
82
-
83
-
84
-
85
-
86
-
87
-
88
-
89
-
90
-
91
-
92
-
93
-
94
-
95
-
96
-
97
-
98
-
99
-
100
-
101
-
102
-
103
-
104
-
105
-
106
-
107
-
108
-
109
-
110
-
111
-
112
-
113
-
114
-
115
-
116
-
117
-
118
-
119
-
120
-
121
-
122
-
123
-
124
-
125
-
126
-
127
-
128
-
129
-
130
-
131
-
132
-
133
-
134
-
135
-
136
-
137
-
138
-
139
-
140
-
141
-
142
-
143
-
144
-
145
-
146
-
147
-
148
-
149
-
150
-
151
-
152
-
153
-
154
-
155
-
156
-
157
-
158
-
159
-
160
-
161
-
162
-
163
-
164
-
165
-
166
-
167
-
168
-
169
-
170
-
171
-
172
-
173
-
174
-
175
-
176
-
177
-
178
-
179
-
180
-
181
-
182
-
183
-
184
-
185
-
186
-
187
-
188
-
189
-
190
-
191
-
192
-
193
-
194
-
195
-
196
-
197
-
198
-
199
-
200
-
201
-
202
-
203
-
204
 |
 |

The performance objectives used to determine the achievement of the individual performance metric are
established at or shortly after the beginning of the fiscal year. The objectives chosen are measurable goals and
communicated internally within our company. The objectives are both financial and non-financial in nature. Each
individual performance metric includes several objectives for the following three key categories and results are
monitored quarterly:
‰Employee — includes objectives to promote a high-performing organization
‰Customer — includes objectives to promote customer and partner satisfaction
‰Stockholder — includes objectives to promote strong financial performance (measured by actual business
results), particularly within the executive’s primary area of responsibility, higher stock price and improve
stockholder returns while discouraging excessive or inappropriate risk taking by the executive officer
Leadership skills are a common component to each of these objectives and are a significant factor in the
assessment of individual performance. The executive’s willingness to contribute to cross-functional initiatives
outside his or her primary area of responsibility, and the executive’s contribution to our company’s performance-
based culture, are also extremely important aspects of the individual performance assessment.
The CEO evaluates the level of each named executive officer’s performance pursuant to the metrics
described above following the end of fiscal year and then makes a recommendation to the Compensation
Committee. The Compensation Committee then reviews the CEO’s compensation recommendations for the other
named executive officers, makes any appropriate adjustments, and approves their compensation. The potential
payout for the individual performance metric ranges from 0% to 150% based on achievement of the preset goals.
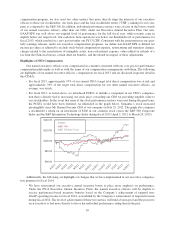
Achievement of Fiscal Year 2013 Performance Metrics:
For fiscal 2013, our revenue target was $7,037 million and our non-GAAP EPS target was $1.66 per share.
The Compensation Committee determined that we achieved 99.1% of the revenue metric, resulting in a 95%
payout for that portion of the plan based on the plan target amount, and 107.5% of the non-GAAP EPS metric,
resulting in a payout for that portion of the plan at 135% of the plan target amount. For purposes of calculating
achievement of these metrics, consistent with the presentation of non-GAAP EPS in our quarterly earnings
releases, foreign exchange movements were held constant at plan rates, pursuant to the terms of the plans.
For fiscal 2013, the individual performance payout level for Messrs. Beer, deSouza, Gillett and Taylor
reflected strong performance ratings as measured by the objectives for the key metrics described above, with a
particular emphasis on their strong leadership skills that were demonstrated during our restructuring and trans-
formational activities in fiscal 2013. We did not assess the individual performance component for Ms. Chaffin,
who left our company at the end of fiscal 2013, because our policy is to apply a 100% individual performance
payout to departing executives as a result of our organizational restructuring that was announced in January 2013
following our strategic and operational review.
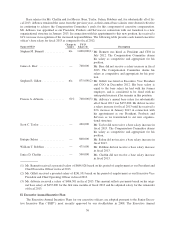
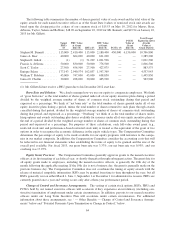
Our named executive officers’ fiscal 2013 annual incentive payout level by performance metric, total payout
as percentage of target opportunity and total payout amounts are provided in the table below:
Revenue
Payout %
EPS
Payout %
Individual
Performance
Payout %
Total
Payout
as % of
Target
Payout
Amount ($)
Stephen M. Bennett ......................... 95 135 n/a 115.0 1,173,760(1)
James A. Beer ............................. 95 135 90 101.5 710,500
Stephen E. Gillett ........................... 95 135 115 109.0 321,858(2)
Francis A. deSouza ......................... 95 135 115 109.0 521,104(3)
Scott C. Taylor ............................. 95 135 105 106.0 289,380
Enrique Salem ............................. — — — — —(4)
William T. Robbins ......................... — — — — —(4)
Janice D. Chaffin ........................... 95 135 100 104.5 496,375
59