Symantec 2013 Annual Report Download - page 179
Download and view the complete annual report
Please find page 179 of the 2013 Symantec annual report below. You can navigate through the pages in the report by either clicking on the pages listed below, or by using the keyword search tool below to find specific information within the annual report.-
 1
1 -
2
-
3
-
4
-
5
-
6
-
7
-
8
-
9
-
10
-
11
-
12
-
13
-
14
-
15
-
16
-
17
-
18
-
19
-
20
-
21
-
22
-
23
-
24
-
25
-
26
-
27
-
28
-
29
-
30
-
31
-
32
-
33
-
34
-
35
-
36
-
37
-
38
-
39
-
40
-
41
-
42
-
43
-
44
-
45
-
46
-
47
-
48
-
49
-
50
-
51
-
52
-
53
-
54
-
55
-
56
-
57
-
58
-
59
-
60
-
61
-
62
-
63
-
64
-
65
-
66
-
67
-
68
-
69
-
70
-
71
-
72
-
73
-
74
-
75
-
76
-
77
-
78
-
79
-
80
-
81
-
82
-
83
-
84
-
85
-
86
-
87
-
88
-
89
-
90
-
91
-
92
-
93
-
94
-
95
-
96
-
97
-
98
-
99
-
100
-
101
-
102
-
103
-
104
-
105
-
106
-
107
-
108
-
109
-
110
-
111
-
112
-
113
-
114
-
115
-
116
-
117
-
118
-
119
-
120
-
121
-
122
-
123
-
124
-
125
-
126
-
127
-
128
-
129
-
130
-
131
-
132
-
133
-
134
-
135
-
136
-
137
-
138
-
139
-
140
-
141
-
142
-
143
-
144
-
145
-
146
-
147
-
148
-
149
-
150
-
151
-
152
-
153
-
154
-
155
-
156
-
157
-
158
-
159
-
160
-
161
-
162
-
163
-
164
-
165
-
166
-
167
-
168
-
 169
169 -
 170
170 -
 171
171 -
 172
172 -
 173
173 -
 174
174 -
 175
175 -
 176
176 -
 177
177 -
 178
178 -
 179
179 -
 180
180 -
 181
181 -
 182
182 -
 183
183 -
 184
184 -
 185
185 -
 186
186 -
 187
187 -
 188
188 -
 189
189 -
190
-
191
-
192
-
193
-
194
-
195
-
196
-
197
-
198
-
199
-
200
-
201
-
202
-
203
-
204
 |
 |

SYMANTEC CORPORATION
Notes to Consolidated Financial Statements — (Continued)
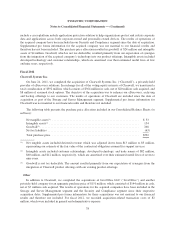
The following table presents the purchase price allocation included in our Consolidated Balance Sheets (in
millions):
GuardianEdge Others Total
Acquisition date ...................................... June 3, 2010 Various
Net tangible assets(1) ................................... $ 3 $ — $ 3
Intangible assets(2) ..................................... 30 6 36
Goodwill(3) .......................................... 40 12 52
Total purchase price ................................... $ 73 $ 18 $91
(1) Net tangible assets included deferred revenue, which was adjusted down from $17 million to $2 million,
representing our estimate of the fair value of the contractual obligation assumed for support services.
(2) Intangible assets included customer relationships of $24 million and developed technology of $12 million,
which are amortized over their estimated useful lives of three to nine years. The weighted-average estimated
useful lives were 9.0 years for customer relationships and 5.0 years for developed technology.
(3) Goodwill is partially tax deductible. The goodwill amount resulted primarily from our expectation of
synergies from the integration of the acquisitions’ product offerings with our existing product offerings.
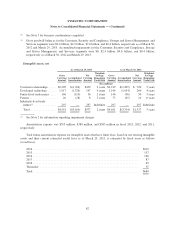
Note 4. Goodwill and Intangible Assets
Goodwill
The changes in the carrying amount of goodwill are as follows:
Consumer
Security and
Compliance
Storage and
Server
Management Services Total
(In millions)
Net balance as of April 1, 2011(1) ..... $363 $2,464 $2,648 $ 19 $5,494
Impairment(2) ................... — — — (19) (19)
Additions(3) .................... — 26 337 — 363
Adjustments .................... (8) (4) — — (12)
Net balance as of March 30, 2012(4) . . . $355 $2,486 $2,985 $ — $5,826
Additions(3) .................... — 24 — — 24
Adjustments .................... — (3) (6) — (9)
Net balance as of March 29, 2013(4) . . . $355 $2,507 $2,979 $ — $5,841
(1) Gross goodwill balances for the Consumer, Security and Compliance, Storage and Server Management, and
Services segments were $0.4 billion, $4.9 billion, $7.2 billion, and $0.4 billion, respectively as of April 1,
2011. Accumulated impairments for the Consumer, Security and Compliance, Storage and Server
Management, and Services segments were $0, $2.4 billion, $4.6 billion, and $0.4 billion, respectively as of
April 1, 2011.
(2) Due to the adoption of new authoritative guidance at the beginning of fiscal 2012, we were required to
perform a goodwill impairment test for our Services reporting unit. As a result, we recognized an
impairment loss of $19 million which was recorded to beginning Accumulated deficit as a cumulative-effect
adjustment.
81