Shaw 2011 Annual Report Download - page 85
Download and view the complete annual report
Please find page 85 of the 2011 Shaw annual report below. You can navigate through the pages in the report by either clicking on the pages listed below, or by using the keyword search tool below to find specific information within the annual report.-
 1
1 -
2
-
3
-
4
-
5
-
6
-
7
-
8
-
9
-
10
-
11
-
12
-
13
-
14
-
15
-
16
-
17
-
18
-
19
-
20
-
21
-
22
-
23
-
24
-
25
-
26
-
27
-
28
-
29
-
30
-
31
-
32
-
33
-
34
-
35
-
36
-
37
-
38
-
39
-
40
-
41
-
42
-
43
-
44
-
45
-
46
-
47
-
48
-
49
-
50
-
51
-
52
-
53
-
54
-
55
-
56
-
57
-
58
-
59
-
60
-
61
-
62
-
63
-
64
-
65
-
66
-
67
-
68
-
69
-
70
-
71
-
72
-
73
-
74
-
 75
75 -
 76
76 -
 77
77 -
 78
78 -
 79
79 -
 80
80 -
 81
81 -
 82
82 -
 83
83 -
 84
84 -
 85
85 -
 86
86 -
 87
87 -
 88
88 -
 89
89 -
 90
90 -
 91
91 -
 92
92 -
 93
93 -
 94
94 -
 95
95 -
96
-
97
-
98
-
99
-
100
-
101
-
102
-
103
-
104
-
105
-
106
-
107
-
108
-
109
-
110
-
111
-
112
-
113
-
114
-
115
-
116
-
117
-
118
-
119
-
120
-
121
-
122
-
123
-
124
-
125
-
126
-
127
-
128
-
129
-
130
-
131
-
132
-
133
-
134
-
135
-
136
-
137
-
138
-
139
-
140
-
141
-
142
-
143
-
144
-
145
-
146
-
147
-
148
-
149
 |
 |

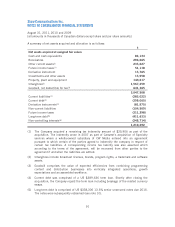
Shaw Communications Inc.
NOTES TO CONSOLIDATED FINANCIAL STATEMENTS
August 31, 2011, 2010 and 2009
[all amounts in thousands of Canadian dollars except share and per share amounts]
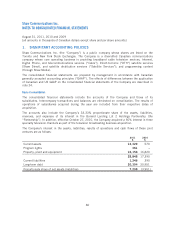
2011
$
2010
$
2009
$
Revenue 26,591 – –
Operating, general and administrative expenses (11,762) 1,829 1,829
Amortization (681) (683) (688)
Interest (1,280) (1,326) (1,358)
Other gains 904 867 879
Proportionate share of income before income taxes 13,772 687 662
Cash flow provided by operating activities 13,260 1,560 1,326
Cash flow used in investing activities –(34) –
Cash flow used in financing activities (576) (541) (509)
Proportionate share of cash distributions 12,684 985 817
Investments and other assets
Investments in other entities are accounted for using the equity method or cost basis depending
upon the level of ownership and/or the Company’s ability to exercise significant influence over
the operating and financial policies of the investee. Investments of this nature are recorded at
original cost and adjusted periodically to recognize the Company’s proportionate share of the
investee’s net income or losses after the date of investment, additional contributions made and
dividends received. Investments are written down when there is clear evidence that a decline in
value that is other than temporary has occurred.
Amounts paid and payable for spectrum licenses were recorded as deposits until Industry
Canada awarded the operating licenses.
Revenue and expenses
(i) Revenue
Revenue from cable, Internet, Digital Phone and DTH customers includes subscriber revenue
earned as services are provided. Satellite distribution services and telecommunications service
revenue is recognized in the period in which the services are rendered to customers. Affiliate
subscriber revenue is recognized monthly based on subscriber levels. Advertising revenues are
recognized in the period in which the advertisements are broadcast and recorded net of agency
commissions as these amounts are paid directly to the agency or advertiser. When a sales
arrangement includes multiple advertising spots, the proceeds are allocated to individual
advertising spots under the arrangement based on relative fair values.
Subscriber connection fees received from customers are deferred and recognized as revenue on
a straight-line basis over two years. Direct and incremental initial selling, administrative and
connection costs related to subscriber acquisitions are recognized as an operating expense as
incurred. The costs of physically connecting a new home are capitalized as part of the
distribution system and costs of disconnections are expensed as incurred.
81