Shaw 2011 Annual Report Download - page 50
Download and view the complete annual report
Please find page 50 of the 2011 Shaw annual report below. You can navigate through the pages in the report by either clicking on the pages listed below, or by using the keyword search tool below to find specific information within the annual report.-
 1
1 -
2
-
3
-
4
-
5
-
6
-
7
-
8
-
9
-
10
-
11
-
12
-
13
-
14
-
15
-
16
-
17
-
18
-
19
-
20
-
21
-
22
-
23
-
24
-
25
-
26
-
27
-
28
-
29
-
30
-
31
-
32
-
33
-
34
-
35
-
36
-
37
-
38
-
39
-
 40
40 -
 41
41 -
 42
42 -
 43
43 -
 44
44 -
 45
45 -
 46
46 -
 47
47 -
 48
48 -
 49
49 -
 50
50 -
 51
51 -
 52
52 -
 53
53 -
 54
54 -
 55
55 -
 56
56 -
 57
57 -
 58
58 -
 59
59 -
 60
60 -
61
-
62
-
63
-
64
-
65
-
66
-
67
-
68
-
69
-
70
-
71
-
72
-
73
-
74
-
75
-
76
-
77
-
78
-
79
-
80
-
81
-
82
-
83
-
84
-
85
-
86
-
87
-
88
-
89
-
90
-
91
-
92
-
93
-
94
-
95
-
96
-
97
-
98
-
99
-
100
-
101
-
102
-
103
-
104
-
105
-
106
-
107
-
108
-
109
-
110
-
111
-
112
-
113
-
114
-
115
-
116
-
117
-
118
-
119
-
120
-
121
-
122
-
123
-
124
-
125
-
126
-
127
-
128
-
129
-
130
-
131
-
132
-
133
-
134
-
135
-
136
-
137
-
138
-
139
-
140
-
141
-
142
-
143
-
144
-
145
-
146
-
147
-
148
-
149
 |
 |

Shaw Communications Inc.
MANAGEMENT’S DISCUSSION AND ANALYSIS
August 31, 2011
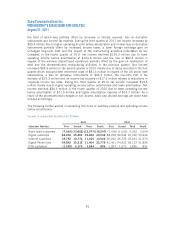
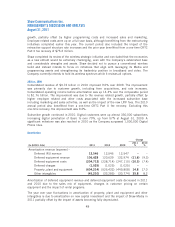
III. RESULTS OF OPERATIONS
OVERVIEW OF FISCAL 2011 CONSOLIDATED RESULTS
Change
(In $000’s Cdn except per share amounts) 2011 2010 2009
2011
%
2010
%
Operations:
Revenue 4,740,903 3,717,580 3,390,913 27.5 9.6
Operating income before
amortization(1) 2,030,828 1,760,147 1,540,609 15.4 14.3
Operating margin(1)(3)(4) 42.8% 45.3% 45.4%
Funds flow from continuing
operations(2) 1,443,179 1,376,799 1,323,840 4.8 4.0
Net income from continuing
operations 562,052 533,776 536,475 5.3 (0.5)
Free cash flow (1) 603,027 515,140 506,075 17.1 1.8
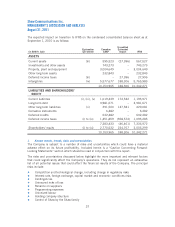
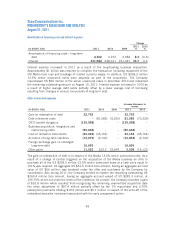
Balance sheet:
Total assets 12,525,877 10,153,965 8,934,686
Long-term financial liabilities
(including current portion)
Long-term debt 5,256,554 3,982,228 3,150,488
Derivative instruments 7,508 86,222 465,610
Other liabilities 512,393 291,500 104,964
5,776,455 4,359,950 3,721,062
Per share data:
Earnings per share from
continuing operations – basic
and diluted $ 1.24 $ 1.23 $ 1.25
Weighted average number of
participating shares outstanding
during period (000’s) 434,881 432,675 429,153
Cash dividends paid per share
Class A 0.897 0.858 0.818
Class B 0.900 0.860 0.820
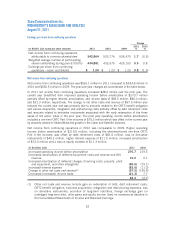
(1) See key performance drivers on page 20.
(2) Funds flow from continuing operations is presented before changes in non-cash working
capital as presented in the Consolidated Statements of Cash Flows.
(3) Operating margin is adjusted to exclude the one-time CRTC Part II recovery for 2010.
Including the one-time CRTC Part II recovery, the operating margin would be 47.3%.
(4) Operating margin has declined in 2011 due to the inclusion of the new Media segment.
46