Shaw 2011 Annual Report Download - page 33
Download and view the complete annual report
Please find page 33 of the 2011 Shaw annual report below. You can navigate through the pages in the report by either clicking on the pages listed below, or by using the keyword search tool below to find specific information within the annual report.-
 1
1 -
2
-
3
-
4
-
5
-
6
-
7
-
8
-
9
-
10
-
11
-
12
-
13
-
14
-
15
-
16
-
17
-
18
-
19
-
20
-
21
-
22
-
 23
23 -
 24
24 -
 25
25 -
 26
26 -
 27
27 -
 28
28 -
 29
29 -
 30
30 -
 31
31 -
 32
32 -
 33
33 -
 34
34 -
 35
35 -
 36
36 -
 37
37 -
 38
38 -
 39
39 -
 40
40 -
 41
41 -
 42
42 -
 43
43 -
44
-
45
-
46
-
47
-
48
-
49
-
50
-
51
-
52
-
53
-
54
-
55
-
56
-
57
-
58
-
59
-
60
-
61
-
62
-
63
-
64
-
65
-
66
-
67
-
68
-
69
-
70
-
71
-
72
-
73
-
74
-
75
-
76
-
77
-
78
-
79
-
80
-
81
-
82
-
83
-
84
-
85
-
86
-
87
-
88
-
89
-
90
-
91
-
92
-
93
-
94
-
95
-
96
-
97
-
98
-
99
-
100
-
101
-
102
-
103
-
104
-
105
-
106
-
107
-
108
-
109
-
110
-
111
-
112
-
113
-
114
-
115
-
116
-
117
-
118
-
119
-
120
-
121
-
122
-
123
-
124
-
125
-
126
-
127
-
128
-
129
-
130
-
131
-
132
-
133
-
134
-
135
-
136
-
137
-
138
-
139
-
140
-
141
-
142
-
143
-
144
-
145
-
146
-
147
-
148
-
149
 |
 |

Shaw Communications Inc.
MANAGEMENT’S DISCUSSION AND ANALYSIS
August 31, 2011
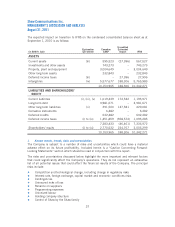
Carrying amount
2011 2010
$$
Broadcast rights and licenses
Cable systems 4,101,937 4,078,021
DTH and satellite services 983,132 983,132
Media 1,382,300 –
6,467,369 5,061,153
Goodwill
Non-regulated satellite services 88,111 88,111
Cable systems 85,332 81,032
Media 641,365 –
814,808 169,143
Wireless spectrum licenses 190,912 190,912
Net book value 7,473,089 5,421,208
viii) Employment benefit plans
Shaw has an unfunded defined benefit pension plan for key senior executives and various
funded defined benefit plans for certain unionized and non-unionized employees. The amounts
reported in the financial statements relating to the defined benefit pension plans are
determined using actuarial valuations that are based on several assumptions. The valuation
uses management’s assumptions for the discount rate, rate of compensation increase, the
expected return on plan assets (for funded plans) and expected average remaining years of
service of employees. While the Company believes these assumptions are reasonable,
differences in actual results or changes in assumptions could affect employee benefit
obligations and the related income statement impact. The Company accounts for differences
between actual and assumed results by recognizing differences in benefit obligations and plan
performance over the working lives of the employees who benefit from the plan. The most
significant assumption used to calculate the net employee benefit plan expense is the discount
rate. The discount rate is the interest rate used to determine the present value of the future
cash flows that is expected will be needed to settle employee benefit obligations. It is based on
the yield of long-term, high-quality corporate fixed income investments closely matching the
term of the estimated future cash flows and is determined at the end of every year. The
following table illustrates the increase on the accrued benefit obligation and pension expense of
a 1% decrease in the discount rate:
Accrued Benefit
Obligation at
End of Fiscal 2011
Pension Expense
Fiscal 2011
Discount Rate – Unfunded Plan 5.50% 5.75%
Weighted Average Discount Rate – Funded Plans 5.75% 5.65%
Impact of: 1% decrease ($000’s Cdn)- Unfunded Plan $56,297 $ 6,467
Impact of: 1% decrease ($000’s Cdn)- Funded Plans $20,212 $ 812
29