Shaw 2011 Annual Report Download - page 48
Download and view the complete annual report
Please find page 48 of the 2011 Shaw annual report below. You can navigate through the pages in the report by either clicking on the pages listed below, or by using the keyword search tool below to find specific information within the annual report.-
 1
1 -
2
-
3
-
4
-
5
-
6
-
7
-
8
-
9
-
10
-
11
-
12
-
13
-
14
-
15
-
16
-
17
-
18
-
19
-
20
-
21
-
22
-
23
-
24
-
25
-
26
-
27
-
28
-
29
-
30
-
31
-
32
-
33
-
34
-
35
-
36
-
37
-
 38
38 -
 39
39 -
 40
40 -
 41
41 -
 42
42 -
 43
43 -
 44
44 -
 45
45 -
 46
46 -
 47
47 -
 48
48 -
 49
49 -
 50
50 -
 51
51 -
 52
52 -
 53
53 -
 54
54 -
 55
55 -
 56
56 -
 57
57 -
 58
58 -
59
-
60
-
61
-
62
-
63
-
64
-
65
-
66
-
67
-
68
-
69
-
70
-
71
-
72
-
73
-
74
-
75
-
76
-
77
-
78
-
79
-
80
-
81
-
82
-
83
-
84
-
85
-
86
-
87
-
88
-
89
-
90
-
91
-
92
-
93
-
94
-
95
-
96
-
97
-
98
-
99
-
100
-
101
-
102
-
103
-
104
-
105
-
106
-
107
-
108
-
109
-
110
-
111
-
112
-
113
-
114
-
115
-
116
-
117
-
118
-
119
-
120
-
121
-
122
-
123
-
124
-
125
-
126
-
127
-
128
-
129
-
130
-
131
-
132
-
133
-
134
-
135
-
136
-
137
-
138
-
139
-
140
-
141
-
142
-
143
-
144
-
145
-
146
-
147
-
148
-
149
 |
 |

Shaw Communications Inc.
MANAGEMENT’S DISCUSSION AND ANALYSIS
August 31, 2011
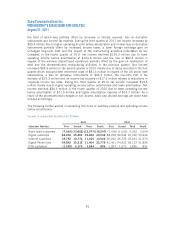
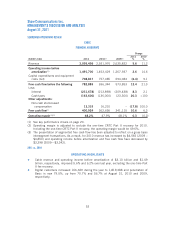
II. SUMMARY OF QUARTERLY RESULTS
(In $000’s
Cdn except
per share
amounts)
Quarter Revenue
Operating
income
before
amortization(1)
Net income
from
continuing
operations
attributable
to common
shareholders
Net income
attributable
to common
shareholders
Net
income(2)
Basic and
diluted
earnings
per share
from
continuing
operations
Basic
and
diluted
earnings
per share
2011
Fourth 1,180,699 476,229 164,458 80,709 82,488 0.37 0.18
Third 1,284,688 581,063 196,187 194,860 202,670 0.45 0.45
Second 1,196,611 499,400 165,101 161,490 167,299 0.38 0.37
First 1,078,905 474,136 17,218 16,642 20,332 0.04 0.04
Total 4,740,903 2,030,828 542,964 453,701 472,789 1.24 1.03
2010
Fourth 938,872 424,458 122,551 121,575 121,575 0.28 0.28
Third 943,632 435,912 158,284 158,216 158,216 0.37 0.37
Second 929,142 424,825 138,712 138,712 138,712 0.32 0.32
First 905,934 474,952 114,229 114,229 114,229 0.26 0.26
Total 3,717,580 1,760,147 533,776 532,732 532,732 1.23 1.23
(1) See key performance drivers on page 20.
(2) Net income attributable to both common shareholders and non-controlling interests.
Generally, revenue and operating income before amortization have grown quarter-over-quarter
mainly due to customer growth and rate increases with the exception of the second and fourth
quarters of 2010 and fourth quarter of 2011. In the fourth quarter of 2011, revenue and
operating income before amortization declined $104.0 million and $104.8 million,
respectively, due to the cyclical nature of the Media business with lower advertising revenues in
the summer months. In the fourth quarter of 2010, revenue and operating income before
amortization declined by $4.8 million and $11.5 million, respectively, due to customer growth
offset by timing of On-Demand events, increased promotional activity and timing of certain
expenses including maintenance and costs related to customer growth. Operating income before
amortization decreased by $50.1 million in the second quarter of 2010 due to the impact of
the one-time Part II fee recovery of $75.3 million recorded in the previous quarter.
Net income has fluctuated quarter-over-quarter primarily as a result of the growth in operating
income before amortization described above and the impact of the net change in non-operating
items. The first quarter of the current year was also impacted by the Media acquisition. As a
result, net income declined by $101.2 million in the first quarter of 2011 as the higher
operating income before amortization of $50.2 million due to the contribution from the new
Media division and lower income taxes of $32.1 million were offset by the CRTC benefit
obligation of $139.1 million and acquisition, integration and restructuring costs of $58.1
million. Net income increased $147.0 million in the second quarter of 2011 due to the impact
of the broadcasting business acquisition in the immediately preceding quarter and higher
operating income before amortization and foreign exchange gain on unhedged long-term debt,
44