Shaw 2011 Annual Report Download - page 57
Download and view the complete annual report
Please find page 57 of the 2011 Shaw annual report below. You can navigate through the pages in the report by either clicking on the pages listed below, or by using the keyword search tool below to find specific information within the annual report.-
 1
1 -
2
-
3
-
4
-
5
-
6
-
7
-
8
-
9
-
10
-
11
-
12
-
13
-
14
-
15
-
16
-
17
-
18
-
19
-
20
-
21
-
22
-
23
-
24
-
25
-
26
-
27
-
28
-
29
-
30
-
31
-
32
-
33
-
34
-
35
-
36
-
37
-
38
-
39
-
40
-
41
-
42
-
43
-
44
-
45
-
46
-
 47
47 -
 48
48 -
 49
49 -
 50
50 -
 51
51 -
 52
52 -
 53
53 -
 54
54 -
 55
55 -
 56
56 -
 57
57 -
 58
58 -
 59
59 -
 60
60 -
 61
61 -
 62
62 -
 63
63 -
 64
64 -
 65
65 -
 66
66 -
 67
67 -
68
-
69
-
70
-
71
-
72
-
73
-
74
-
75
-
76
-
77
-
78
-
79
-
80
-
81
-
82
-
83
-
84
-
85
-
86
-
87
-
88
-
89
-
90
-
91
-
92
-
93
-
94
-
95
-
96
-
97
-
98
-
99
-
100
-
101
-
102
-
103
-
104
-
105
-
106
-
107
-
108
-
109
-
110
-
111
-
112
-
113
-
114
-
115
-
116
-
117
-
118
-
119
-
120
-
121
-
122
-
123
-
124
-
125
-
126
-
127
-
128
-
129
-
130
-
131
-
132
-
133
-
134
-
135
-
136
-
137
-
138
-
139
-
140
-
141
-
142
-
143
-
144
-
145
-
146
-
147
-
148
-
149
 |
 |

Shaw Communications Inc.
MANAGEMENT’S DISCUSSION AND ANALYSIS
August 31, 2011
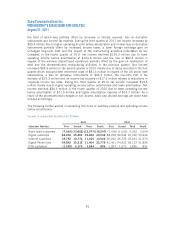
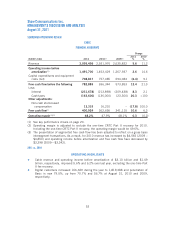
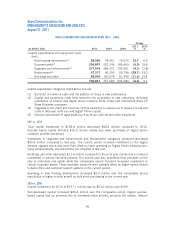
SEGMENTED OPERATIONS REVIEW
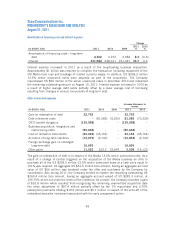
CABLE
FINANCIAL HIGHLIGHTS
Change
($000’s Cdn) 2011 2010(3) 2009(3)
2011
%
2010
%
Revenue 3,095,456 2,931,976 2,635,832 5.6 11.2
Operating income before
amortization(1) 1,491,700 1,453,429 1,267,937 2.6 14.6
Capital expenditures and equipment
costs (net) 708,817 757,085 694,084 (6.4) 9.1
Free cash flow before the following 782,883 696,344 573,853 12.4 21.3
Less:
Interest (231,678) (213,898) (209,438) 8.3 2.1
Cash taxes (163,600) (136,000) (23,300) 20.3 >100
Other adjustments:
Non-cash stock-based
compensation 13,319 16,210 – (17.8) 100.0
Free cash flow(1) 400,924 362,656 341,115 10.6 6.3
Operating margin(1)(2) 48.2% 47.9% 48.1% 0.3 (0.2)
(1) See key performance drivers on page 20.
(2) Operating margin is adjusted to exclude the one-time CRTC Part II recovery for 2010.
Including the one-time CRTC Part II recovery, the operating margin would be 49.6%.
(3) The presentation of segmented free cash flow has been adjusted to reflect on a gross basis
intersegment transactions. As a result, for 2010 revenue has increased by $4,565 (2009 –
$4,850) and operating income before amortization and free cash flow have decreased by
$3,398 (2009—$3,342).
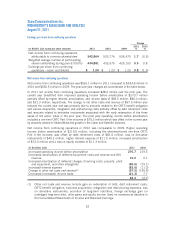
2011 vs. 2010
OPERATING HIGHLIGHTS
ŠCable revenue and operating income before amortization of $3.10 billion and $1.49
billion, respectively, improved 5.6% and 6.2% over last year, excluding the one-time Part
II fee recovery.
ŠDigital customers increased 166,369 during the year to 1,819,388 and penetration of
Basic is now 79.5%, up from 70.7% and 56.7% at August 31, 2010 and 2009,
respectively.
53