Shaw 2011 Annual Report Download - page 100
Download and view the complete annual report
Please find page 100 of the 2011 Shaw annual report below. You can navigate through the pages in the report by either clicking on the pages listed below, or by using the keyword search tool below to find specific information within the annual report.-
 1
1 -
2
-
3
-
4
-
5
-
6
-
7
-
8
-
9
-
10
-
11
-
12
-
13
-
14
-
15
-
16
-
17
-
18
-
19
-
20
-
21
-
22
-
23
-
24
-
25
-
26
-
27
-
28
-
29
-
30
-
31
-
32
-
33
-
34
-
35
-
36
-
37
-
38
-
39
-
40
-
41
-
42
-
43
-
44
-
45
-
46
-
47
-
48
-
49
-
50
-
51
-
52
-
53
-
54
-
55
-
56
-
57
-
58
-
59
-
60
-
61
-
62
-
63
-
64
-
65
-
66
-
67
-
68
-
69
-
70
-
71
-
72
-
73
-
74
-
75
-
76
-
77
-
78
-
79
-
80
-
81
-
82
-
83
-
84
-
85
-
86
-
87
-
88
-
89
-
 90
90 -
 91
91 -
 92
92 -
 93
93 -
 94
94 -
 95
95 -
 96
96 -
 97
97 -
 98
98 -
 99
99 -
 100
100 -
 101
101 -
 102
102 -
 103
103 -
 104
104 -
 105
105 -
 106
106 -
 107
107 -
 108
108 -
 109
109 -
 110
110 -
111
-
112
-
113
-
114
-
115
-
116
-
117
-
118
-
119
-
120
-
121
-
122
-
123
-
124
-
125
-
126
-
127
-
128
-
129
-
130
-
131
-
132
-
133
-
134
-
135
-
136
-
137
-
138
-
139
-
140
-
141
-
142
-
143
-
144
-
145
-
146
-
147
-
148
-
149
 |
 |

Shaw Communications Inc.
NOTES TO CONSOLIDATED FINANCIAL STATEMENTS
August 31, 2011, 2010 and 2009
[all amounts in thousands of Canadian dollars except share and per share amounts]
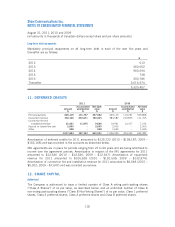
7. PROPERTY, PLANT AND EQUIPMENT
2011 2010
Accumulated Net book Accumulated Net book
Cost amortization value Cost amortization value
$$$$$ $
Cable and telecommunications
distribution system 4,348,683 2,243,547 2,105,136 4,197,319 2,129,039 2,068,280
Digital cable terminals and
modems 648,495 298,572 349,923 552,224 223,910 328,314
Satellite audio, video and data
network equipment and DTH
receiving equipment 160,836 128,735 32,101 154,156 115,139 39,017
Transmitters, broadcasting,
communications and
production equipment 75,875 11,279 64,596 –– –
Buildings 402,786 138,407 264,379 360,841 121,312 239,529
Data processing 72,878 38,616 34,262 53,811 30,679 23,132
Other assets 281,154 103,610 177,544 256,910 120,020 136,890
5,990,707 2,962,766 3,027,941 5,575,261 2,740,099 2,835,162
Land 61,076 – 61,076 45,368 – 45,368
Assets under construction 111,183 – 111,183 124,119 – 124,119
6,162,966 2,962,766 3,200,200 5,744,748 2,740,099 3,004,649
Included in the cable and telecommunications distribution system assets is the cost of the
Company’s purchase of fibres under IRU agreements with terms extending to 60 years totalling
$61,811 (2010 – $61,811). In 2011, the Company recognized a gain (loss) of $4,232 (2010
– ($2,665); 2009 – $8,360) on the disposal of property, plant and equipment.
8. OTHER LONG-TERM ASSETS
2011 2010
Accumulated Net book Accumulated Net book
Cost amortization value Cost amortization value
$$$$$ $
Equipment costs subject to a
deferred revenue
arrangement 650,296 434,287 216,009 687,879 485,449 202,430
Credit facility arrangement
fees 5,039 4,284 755 5,039 3,276 1,763
Other 41,174 170 41,004 28,803 153 28,650
696,509 438,741 257,768 721,721 488,878 232,843
Amortization provided in the accounts for 2011 amounted to $205,737 (2010 – $229,782;
2009 – $248,308) and was recorded as amortization of deferred charges and equipment costs
(2010 – $229,739; 2009 – $248,135). In 2010 and 2009, $43 and $173 was recorded as
operating, general and administrative expenses.
96