Shaw 2011 Annual Report Download - page 111
Download and view the complete annual report
Please find page 111 of the 2011 Shaw annual report below. You can navigate through the pages in the report by either clicking on the pages listed below, or by using the keyword search tool below to find specific information within the annual report.-
 1
1 -
2
-
3
-
4
-
5
-
6
-
7
-
8
-
9
-
10
-
11
-
12
-
13
-
14
-
15
-
16
-
17
-
18
-
19
-
20
-
21
-
22
-
23
-
24
-
25
-
26
-
27
-
28
-
29
-
30
-
31
-
32
-
33
-
34
-
35
-
36
-
37
-
38
-
39
-
40
-
41
-
42
-
43
-
44
-
45
-
46
-
47
-
48
-
49
-
50
-
51
-
52
-
53
-
54
-
55
-
56
-
57
-
58
-
59
-
60
-
61
-
62
-
63
-
64
-
65
-
66
-
67
-
68
-
69
-
70
-
71
-
72
-
73
-
74
-
75
-
76
-
77
-
78
-
79
-
80
-
81
-
82
-
83
-
84
-
85
-
86
-
87
-
88
-
89
-
90
-
91
-
92
-
93
-
94
-
95
-
96
-
97
-
98
-
99
-
100
-
 101
101 -
 102
102 -
 103
103 -
 104
104 -
 105
105 -
 106
106 -
 107
107 -
 108
108 -
 109
109 -
 110
110 -
 111
111 -
 112
112 -
 113
113 -
 114
114 -
 115
115 -
 116
116 -
 117
117 -
 118
118 -
 119
119 -
 120
120 -
 121
121 -
122
-
123
-
124
-
125
-
126
-
127
-
128
-
129
-
130
-
131
-
132
-
133
-
134
-
135
-
136
-
137
-
138
-
139
-
140
-
141
-
142
-
143
-
144
-
145
-
146
-
147
-
148
-
149
 |
 |

Shaw Communications Inc.
NOTES TO CONSOLIDATED FINANCIAL STATEMENTS
August 31, 2011, 2010 and 2009
[all amounts in thousands of Canadian dollars except share and per share amounts]
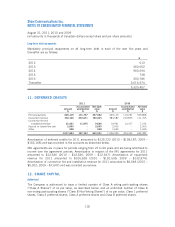
Earnings per share
Earnings per share calculations are as follows:
2011 2010 2009
Numerator for basic and diluted earnings per share ($)
Net income from continuing operations 562,052 533,776 536,475
Deduct: net income attributable to non-controlling interests (19,088) ––
Deduct: dividends on Series A Preferred Shares (3,624) ––
Net income from continuing operations attributable to
common shareholders 539,340 533,776 536,475
Net loss from discontinued operations attributable to
common shareholders (89,263) (1,044) –
Net income attributable to common shareholders 450,077 532,732 536,475
Denominator (thousands of shares)
Weighted average number of Class A Shares and Class B
Non-Voting Shares for basic earnings per share 434,881 432,675 429,153
Effect of potentially dilutive securities 1,071 1,207 1,628
Weighted average number of Class A Shares and Class B
Non-Voting Shares for diluted earnings per share 435,952 433,882 430,781
Earnings per share – basic and diluted ($)
Earnings per share from continuing operations 1.24 1.23 1.25
Loss per share from discontinued operations (0.21) ––
Earnings per share 1.03 1.23 1.25
Options to purchase 21,970,400 Class B Non-Voting Shares were outstanding under the
Company’s stock option plan at August 31, 2011 (2010 – 23,993,150; 2009 – 23,714,667).
13. OTHER COMPREHENSIVE INCOME (LOSS) AND ACCUMULATED OTHER
COMPREHENSIVE INCOME
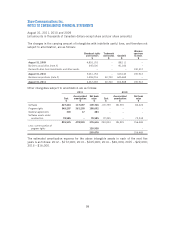
Components of other comprehensive income (loss) and the related income tax effects for 2011
are as follows:
Amount Income taxes Net
$$$
Change in unrealized fair value of derivatives designated as
cash flow hedges (14,322) 2,552 (11,770)
Adjustment for hedged items recognized in the period 5,880 (1,606) 4,274
Unrealized loss on available-for-sale investment (12) 2 (10)
Unrealized foreign exchange loss on translation of a self-
sustaining foreign operation (3) – (3)
(8,457) 948 (7,509)
107