Shaw 2011 Annual Report Download - page 61
Download and view the complete annual report
Please find page 61 of the 2011 Shaw annual report below. You can navigate through the pages in the report by either clicking on the pages listed below, or by using the keyword search tool below to find specific information within the annual report.-
 1
1 -
2
-
3
-
4
-
5
-
6
-
7
-
8
-
9
-
10
-
11
-
12
-
13
-
14
-
15
-
16
-
17
-
18
-
19
-
20
-
21
-
22
-
23
-
24
-
25
-
26
-
27
-
28
-
29
-
30
-
31
-
32
-
33
-
34
-
35
-
36
-
37
-
38
-
39
-
40
-
41
-
42
-
43
-
44
-
45
-
46
-
47
-
48
-
49
-
50
-
 51
51 -
 52
52 -
 53
53 -
 54
54 -
 55
55 -
 56
56 -
 57
57 -
 58
58 -
 59
59 -
 60
60 -
 61
61 -
 62
62 -
 63
63 -
 64
64 -
 65
65 -
 66
66 -
 67
67 -
 68
68 -
 69
69 -
 70
70 -
 71
71 -
72
-
73
-
74
-
75
-
76
-
77
-
78
-
79
-
80
-
81
-
82
-
83
-
84
-
85
-
86
-
87
-
88
-
89
-
90
-
91
-
92
-
93
-
94
-
95
-
96
-
97
-
98
-
99
-
100
-
101
-
102
-
103
-
104
-
105
-
106
-
107
-
108
-
109
-
110
-
111
-
112
-
113
-
114
-
115
-
116
-
117
-
118
-
119
-
120
-
121
-
122
-
123
-
124
-
125
-
126
-
127
-
128
-
129
-
130
-
131
-
132
-
133
-
134
-
135
-
136
-
137
-
138
-
139
-
140
-
141
-
142
-
143
-
144
-
145
-
146
-
147
-
148
-
149
 |
 |

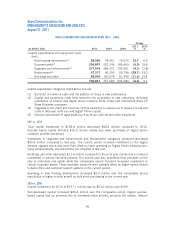
Shaw Communications Inc.
MANAGEMENT’S DISCUSSION AND ANALYSIS
August 31, 2011
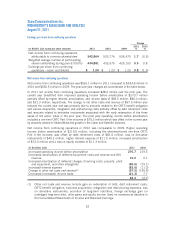
success-based capital also increased mainly due to the deployment of higher cost Internet
modems related to the launch of the DOCSIS 2.0 and 3.0 integrated Wi-Fi modems.
Investment in Upgrades and enhancement and Replacement categories combined was
comparable to 2009. Shaw continued to invest in technology initiatives to recapture bandwidth
and optimize its network, including increasing the number of nodes on the network and using
advanced encoding and digital compression technologies such as MPEG4.
Investment in Buildings and Other was up $19.1 million over the prior year. The increase was
mainly due to proceeds that benefitted the prior year related to the sale of certain redundant
facilities.
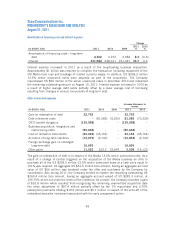
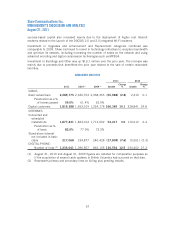
SUBSCRIBER STATISTICS
2011 2010
2011 2010(1) 2009(1) Growth
Change
% Growth
Change
%
CABLE:
Basic subscribers 2,289,775 2,340,763 2,338,353 (50,988) (2.2) 2,410 0.1
Penetration as a %
of homes passed 59.0% 61.4% 62.9%
Digital customers 1,819,388 1,653,019 1,324,178 166,369 10.1 328,841 24.8
INTERNET:
Connected and
scheduled
installations 1,877,231 1,823,014 1,713,002 54,217 3.0 110,012 6.4
Penetration as %
of basic 82.0% 77.9% 73.3%
Stand-alone Internet
not included in basic
cable 217,068 234,877 240,428 (17,809) (7.6) (5,551) (2.3)
DIGITAL PHONE:
Number of lines (2) 1,233,041 1,096,507 862,105 136,534 12.5 234,402 27.2
(1) August 31, 2010 and August 31, 2009 figures are restated for comparative purposes as
if the acquisition of several cable systems in British Columbia had occurred on that date.
(2) Represents primary and secondary lines on billing plus pending installs.
57