Shaw 2011 Annual Report Download - page 145
Download and view the complete annual report
Please find page 145 of the 2011 Shaw annual report below. You can navigate through the pages in the report by either clicking on the pages listed below, or by using the keyword search tool below to find specific information within the annual report.-
 1
1 -
2
-
3
-
4
-
5
-
6
-
7
-
8
-
9
-
10
-
11
-
12
-
13
-
14
-
15
-
16
-
17
-
18
-
19
-
20
-
21
-
22
-
23
-
24
-
25
-
26
-
27
-
28
-
29
-
30
-
31
-
32
-
33
-
34
-
35
-
36
-
37
-
38
-
39
-
40
-
41
-
42
-
43
-
44
-
45
-
46
-
47
-
48
-
49
-
50
-
51
-
52
-
53
-
54
-
55
-
56
-
57
-
58
-
59
-
60
-
61
-
62
-
63
-
64
-
65
-
66
-
67
-
68
-
69
-
70
-
71
-
72
-
73
-
74
-
75
-
76
-
77
-
78
-
79
-
80
-
81
-
82
-
83
-
84
-
85
-
86
-
87
-
88
-
89
-
90
-
91
-
92
-
93
-
94
-
95
-
96
-
97
-
98
-
99
-
100
-
101
-
102
-
103
-
104
-
105
-
106
-
107
-
108
-
109
-
110
-
111
-
112
-
113
-
114
-
115
-
116
-
117
-
118
-
119
-
120
-
121
-
122
-
123
-
124
-
125
-
126
-
127
-
128
-
129
-
130
-
131
-
132
-
133
-
134
-
 135
135 -
 136
136 -
 137
137 -
 138
138 -
 139
139 -
 140
140 -
 141
141 -
 142
142 -
 143
143 -
 144
144 -
 145
145 -
 146
146 -
 147
147 -
 148
148 -
 149
149
 |
 |

Shaw Communications Inc.
NOTES TO CONSOLIDATED FINANCIAL STATEMENTS
August 31, 2011, 2010 and 2009
[all amounts in thousands of Canadian dollars except share and per share amounts]
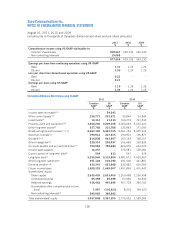
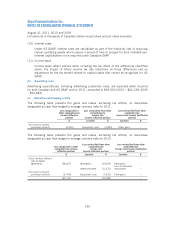
The following table presents the gains and losses, excluding tax effects, on derivatives
designated as cash flow hedges to manage currency risks for 2009.
Gain recognized in other
comprehensive income
(effective portion)
Gain (loss) reclassified from
other comprehensive
income into
income (effective portion)
Gain (loss) reclassified from
other comprehensive
income into
income (ineffective portion)
$ Location $ Location $
Cross-currency interest rate
exchange agreements 24,799 Other gains 31,845 Other gains –
Interest expense (26,313)
Loss on derivative
instruments –
US currency forward purchase
contracts 15,278 Equipment costs 11,795 Other gains –
40,077 17,327 –
The following table presents gains and losses, excluding tax effects, arising from derivatives
that were not designated as hedges.
Gain (loss) recognized in income
Location
2011
$
2010
$
Cross-currency interest rate exchange
agreements Gain/loss on derivative instruments (8,317) 4,958
US currency forward purchase
contracts Gain/loss on derivative instruments (6,391) 10,002
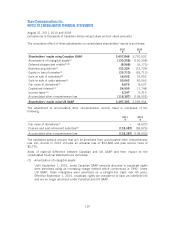
25. COMPARATIVE CONSOLIDATED FINANCIAL STATEMENTS
Certain of the comparative figures have been reclassified to conform to the presentation
adopted in the current year.
141