Shaw 2011 Annual Report Download - page 136
Download and view the complete annual report
Please find page 136 of the 2011 Shaw annual report below. You can navigate through the pages in the report by either clicking on the pages listed below, or by using the keyword search tool below to find specific information within the annual report.-
 1
1 -
2
-
3
-
4
-
5
-
6
-
7
-
8
-
9
-
10
-
11
-
12
-
13
-
14
-
15
-
16
-
17
-
18
-
19
-
20
-
21
-
22
-
23
-
24
-
25
-
26
-
27
-
28
-
29
-
30
-
31
-
32
-
33
-
34
-
35
-
36
-
37
-
38
-
39
-
40
-
41
-
42
-
43
-
44
-
45
-
46
-
47
-
48
-
49
-
50
-
51
-
52
-
53
-
54
-
55
-
56
-
57
-
58
-
59
-
60
-
61
-
62
-
63
-
64
-
65
-
66
-
67
-
68
-
69
-
70
-
71
-
72
-
73
-
74
-
75
-
76
-
77
-
78
-
79
-
80
-
81
-
82
-
83
-
84
-
85
-
86
-
87
-
88
-
89
-
90
-
91
-
92
-
93
-
94
-
95
-
96
-
97
-
98
-
99
-
100
-
101
-
102
-
103
-
104
-
105
-
106
-
107
-
108
-
109
-
110
-
111
-
112
-
113
-
114
-
115
-
116
-
117
-
118
-
119
-
120
-
121
-
122
-
123
-
124
-
125
-
 126
126 -
 127
127 -
 128
128 -
 129
129 -
 130
130 -
 131
131 -
 132
132 -
 133
133 -
 134
134 -
 135
135 -
 136
136 -
 137
137 -
 138
138 -
 139
139 -
 140
140 -
 141
141 -
 142
142 -
 143
143 -
 144
144 -
 145
145 -
 146
146 -
147
-
148
-
149
 |
 |

Shaw Communications Inc.
NOTES TO CONSOLIDATED FINANCIAL STATEMENTS
August 31, 2011, 2010 and 2009
[all amounts in thousands of Canadian dollars except share and per share amounts]
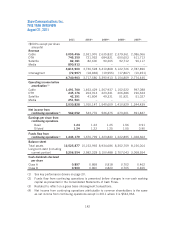
22. CONSOLIDATED STATEMENTS OF CASH FLOWS
Additional disclosures with respect to the Consolidated Statements of Cash Flows are as
follows:
(i) Funds flow from continuing operations
2011 2010 2009
$$$
Net income from continuing operations 562,052 533,776 536,475
Adjustments to reconcile net income to funds flow
from operations
Amortization –
Deferred IRU revenue (12,546) (12,546) (12,547)
Deferred equipment revenue (106,628) (120,639) (132,974)
Deferred equipment costs 204,712 228,714 247,110
Deferred charges 1,025 1,025 1,025
Property, plant and equipment 604,214 526,432 449,808
Other intangibles 45,210 33,285 30,774
Financing costs – long-term debt 4,302 3,972 3,984
Program rights 101,106 ––
Future income tax expense (recovery) (4,820) 15,722 167,897
Equity loss (income) on investee (14,200) 11,250 99
Debt retirement costs –81,585 8,255
Gain on redemption of debt (32,752) ––
CRTC benefit obligation [note 2] 139,098 ––
CRTC benefit obligation payments (30,357) ––
Business acquisition, integration and restructuring
expenses 37,196 ––
Stock-based compensation 14,691 17,838 16,974
Defined benefit pension plans 29,610 27,875 26,052
Loss on derivative instruments 22,022 45,164 –
Realized loss on settlement of derivative
instruments (29,245) (26,357) –
Payments on cross-currency agreements [note 2] (86,109) ––
Foreign exchange gain on unhedged long-term debt (16,695) ––
Accretion of long-term liabilities 14,975 2,142 –
Gain on cancellation of bond forward –– (10,757)
Other (3,682) 7,561 (8,335)
Funds flow from continuing operations 1,443,179 1,376,799 1,323,840
132