Shaw 2011 Annual Report Download - page 123
Download and view the complete annual report
Please find page 123 of the 2011 Shaw annual report below. You can navigate through the pages in the report by either clicking on the pages listed below, or by using the keyword search tool below to find specific information within the annual report.-
 1
1 -
2
-
3
-
4
-
5
-
6
-
7
-
8
-
9
-
10
-
11
-
12
-
13
-
14
-
15
-
16
-
17
-
18
-
19
-
20
-
21
-
22
-
23
-
24
-
25
-
26
-
27
-
28
-
29
-
30
-
31
-
32
-
33
-
34
-
35
-
36
-
37
-
38
-
39
-
40
-
41
-
42
-
43
-
44
-
45
-
46
-
47
-
48
-
49
-
50
-
51
-
52
-
53
-
54
-
55
-
56
-
57
-
58
-
59
-
60
-
61
-
62
-
63
-
64
-
65
-
66
-
67
-
68
-
69
-
70
-
71
-
72
-
73
-
74
-
75
-
76
-
77
-
78
-
79
-
80
-
81
-
82
-
83
-
84
-
85
-
86
-
87
-
88
-
89
-
90
-
91
-
92
-
93
-
94
-
95
-
96
-
97
-
98
-
99
-
100
-
101
-
102
-
103
-
104
-
105
-
106
-
107
-
108
-
109
-
110
-
111
-
112
-
 113
113 -
 114
114 -
 115
115 -
 116
116 -
 117
117 -
 118
118 -
 119
119 -
 120
120 -
 121
121 -
 122
122 -
 123
123 -
 124
124 -
 125
125 -
 126
126 -
 127
127 -
 128
128 -
 129
129 -
 130
130 -
 131
131 -
 132
132 -
 133
133 -
134
-
135
-
136
-
137
-
138
-
139
-
140
-
141
-
142
-
143
-
144
-
145
-
146
-
147
-
148
-
149
 |
 |

Shaw Communications Inc.
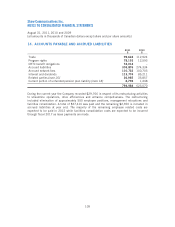
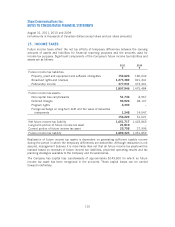
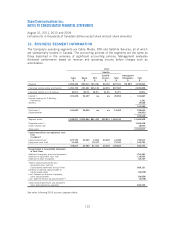
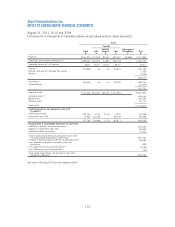
NOTES TO CONSOLIDATED FINANCIAL STATEMENTS
August 31, 2011, 2010 and 2009
[all amounts in thousands of Canadian dollars except share and per share amounts]
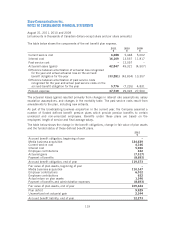
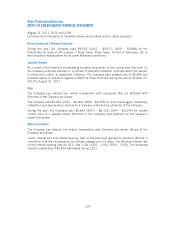
The table below shows the components of the net benefit plan expense.
2011
$
2010
$
2009
$
Current service cost 6,288 5,448 5,002
Interest cost 16,109 13,557 11,817
Past service cost –12,057 –
Actuarial losses (gains) 42,847 49,321 (4,507)
Difference between amortization of actuarial loss recognized
for the year and actual actuarial loss on the accrued
benefit obligation for the year (33,281) (43,834) 10,357
Difference between amortization of past service costs
recognized for the year and actual past service costs on the
accrued benefit obligation for the year 5,776 (7,226) 4,831
Pension expense 37,739 29,323 27,500
The actuarial losses (gains) resulted primarily from changes in interest rate assumptions, salary
escalation assumptions, and changes in the mortality table. The past service costs result from
amendments to the plan, including new entrants.
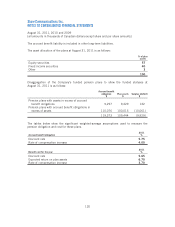
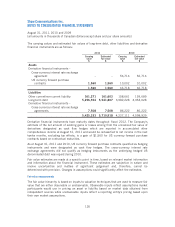
As part of the broadcasting business acquisition in the current year, the Company assumed a
number of funded defined benefit pension plans which provide pension benefits to certain
unionized and non-unionized employees. Benefits under these plans are based on the
employees’ length of service and final average salary.
The table below shows the change in the benefit obligations, change in fair value of plan assets
and the funded status of these defined benefit plans.
2011
$
Accrued benefit obligation, beginning of year –
Media business acquisition 124,639
Current service cost 4,146
Interest cost 5,966
Employee contributions 632
Actuarial gains (7,317)
Payment of benefits (8,693)
Accrued benefit obligation, end of year 119,373
Fair value of plan assets, beginning of year –
Media business acquisition 110,147
Employer contributions 6,012
Employee contributions 632
Actual return on plan assets 1,346
Payment of benefits and administrative expenses (8,693)
Fair value of plan assets, end of year 109,444
Plan deficit 9,929
Unamortized net actuarial gain 2,344
Accrued benefit liability, end of year 12,273
119