Shaw 2011 Annual Report Download - page 117
Download and view the complete annual report
Please find page 117 of the 2011 Shaw annual report below. You can navigate through the pages in the report by either clicking on the pages listed below, or by using the keyword search tool below to find specific information within the annual report.-
 1
1 -
2
-
3
-
4
-
5
-
6
-
7
-
8
-
9
-
10
-
11
-
12
-
13
-
14
-
15
-
16
-
17
-
18
-
19
-
20
-
21
-
22
-
23
-
24
-
25
-
26
-
27
-
28
-
29
-
30
-
31
-
32
-
33
-
34
-
35
-
36
-
37
-
38
-
39
-
40
-
41
-
42
-
43
-
44
-
45
-
46
-
47
-
48
-
49
-
50
-
51
-
52
-
53
-
54
-
55
-
56
-
57
-
58
-
59
-
60
-
61
-
62
-
63
-
64
-
65
-
66
-
67
-
68
-
69
-
70
-
71
-
72
-
73
-
74
-
75
-
76
-
77
-
78
-
79
-
80
-
81
-
82
-
83
-
84
-
85
-
86
-
87
-
88
-
89
-
90
-
91
-
92
-
93
-
94
-
95
-
96
-
97
-
98
-
99
-
100
-
101
-
102
-
103
-
104
-
105
-
106
-
 107
107 -
 108
108 -
 109
109 -
 110
110 -
 111
111 -
 112
112 -
 113
113 -
 114
114 -
 115
115 -
 116
116 -
 117
117 -
 118
118 -
 119
119 -
 120
120 -
 121
121 -
 122
122 -
 123
123 -
 124
124 -
 125
125 -
 126
126 -
 127
127 -
128
-
129
-
130
-
131
-
132
-
133
-
134
-
135
-
136
-
137
-
138
-
139
-
140
-
141
-
142
-
143
-
144
-
145
-
146
-
147
-
148
-
149
 |
 |
Shaw Communications Inc.
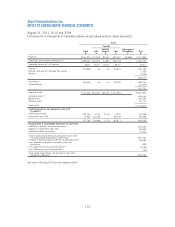
NOTES TO CONSOLIDATED FINANCIAL STATEMENTS
August 31, 2011, 2010 and 2009
[all amounts in thousands of Canadian dollars except share and per share amounts]
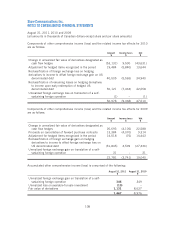
2010
Satellite
Cable
$
DTH
$
Satellite
Services
$
Total
$
Intersegment
Eliminations
$
Total
$
Revenue 2,931,976 721,952 82,600 804,552 (18,948) 3,717,580
Operating income before amortization (6) 1,453,429 264,914 41,804 306,718 – 1,760,147
Operating income as % of revenue 49.6% 36.7% 50.6% 38.1% – 47.3%
Interest (1) 213,898 n/a n/a 26,251 – 240,149
Burrard Landing Lot 2 Holdings Partnership 1,326
Wireless 6,536
248,011
Cash taxes (2) 136,000 n/a n/a 44,000 – 180,000
Corporate/other (12,233)
167,767
Segment assets 7,111,526 844,502 483,404 1,327,906 – 8,439,432
Corporate assets (1) 878,694
Media assets 739,125
Wireless assets 96,714
Total assets 10,153,965
Capital expenditures and equipment costs (net)
by segment
Capital expenditures 739,136 3,139 2,113 5,252 – 744,388
Equipment costs (net) 17,949 80,359 – 80,359 – 98,308
757,085 83,498 2,113 85,611 – 842,696
Reconciliation to Consolidated Statements of Cash Flows
Additions to property, plant and equipment 675,036
Additions to equipment costs (net) 98,308
Additions to other intangibles 37,200
Total of capital expenditures and equipment costs (net)
per Consolidated Statements of Cash Flows 810,544
Increase in working capital related to capital expenditures 35,656
Less: Proceeds on disposal of property, plant and
equipment (430)
Less: Satellite services equipment profit (4) (3,040)
Less: Partnership capital expenditures (5) (34)
Total capital expenditures and equipment costs (net)
reported by segments 842,696
See notes following 2009 business segment table.
113