Shaw 2011 Annual Report Download - page 83
Download and view the complete annual report
Please find page 83 of the 2011 Shaw annual report below. You can navigate through the pages in the report by either clicking on the pages listed below, or by using the keyword search tool below to find specific information within the annual report.-
 1
1 -
2
-
3
-
4
-
5
-
6
-
7
-
8
-
9
-
10
-
11
-
12
-
13
-
14
-
15
-
16
-
17
-
18
-
19
-
20
-
21
-
22
-
23
-
24
-
25
-
26
-
27
-
28
-
29
-
30
-
31
-
32
-
33
-
34
-
35
-
36
-
37
-
38
-
39
-
40
-
41
-
42
-
43
-
44
-
45
-
46
-
47
-
48
-
49
-
50
-
51
-
52
-
53
-
54
-
55
-
56
-
57
-
58
-
59
-
60
-
61
-
62
-
63
-
64
-
65
-
66
-
67
-
68
-
69
-
70
-
71
-
72
-
 73
73 -
 74
74 -
 75
75 -
 76
76 -
 77
77 -
 78
78 -
 79
79 -
 80
80 -
 81
81 -
 82
82 -
 83
83 -
 84
84 -
 85
85 -
 86
86 -
 87
87 -
 88
88 -
 89
89 -
 90
90 -
 91
91 -
 92
92 -
 93
93 -
94
-
95
-
96
-
97
-
98
-
99
-
100
-
101
-
102
-
103
-
104
-
105
-
106
-
107
-
108
-
109
-
110
-
111
-
112
-
113
-
114
-
115
-
116
-
117
-
118
-
119
-
120
-
121
-
122
-
123
-
124
-
125
-
126
-
127
-
128
-
129
-
130
-
131
-
132
-
133
-
134
-
135
-
136
-
137
-
138
-
139
-
140
-
141
-
142
-
143
-
144
-
145
-
146
-
147
-
148
-
149
 |
 |

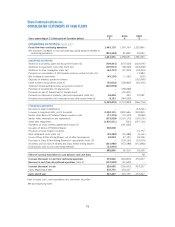
Shaw Communications Inc.
CONSOLIDATED STATEMENTS OF CASH FLOWS
2011 2010 2009
Years ended August 31 [thousands of Canadian dollars] $ $ $
OPERATING ACTIVITIES [note 22]
Funds flow from continuing operations 1,443,179 1,376,799 1,323,840
Net decrease (increase) in non-cash working capital balances related to
continuing operations (201,528) 81,852 59,090
1,241,651 1,458,651 1,382,930
INVESTING ACTIVITIES
Additions to property, plant and equipment [note 16] (704,461) (675,036) (623,695)
Additions to equipment costs (net) [note 16] (119,933) (98,308) (124,968)
Additions to other intangibles [note 16] (64,727) (37,200) (54,223)
Proceeds on cancellation of US forward purchase contracts [note 16] –– 13,384
Net increase to inventories (43,130) (1,261) (530)
Deposits on wireless spectrum licenses –– (152,465)
Cable business acquisitions [note 2] (35,652) (158,805) (46,300)
Television broadcasting business acquisitions [note 2] (416,978) ––
Purchase of Government of Canada bond –(158,968) –
Proceeds on sale of Government of Canada bond –159,405 –
Proceeds on disposal of property, plant and equipment [note 16] 26,826 430 22,081
Proceeds from (additions to) investments and other assets [note 6] 8,181 (744,096) –
(1,349,874) (1,713,839) (966,716)
FINANCING ACTIVITIES
Decrease in bank indebtedness –– (44,201)
Increase in long-term debt, net of discounts 2,352,115 1,891,656 839,839
Senior notes Series A Preferred Shares issuance costs (17,339) (10,109) (4,684)
Senior notes redemptions and repayments (333,928) (1,016,170) (130,000)
Other debt repayments (1,470,511) (541) (297,124)
Payments on cross-currency agreements [note 21] –(291,920) –
Issuance of Series A Preferred Shares 300,000 ––
Proceeds on bond forward contracts –– 10,757
Debt retirement costs [note 10] (19,482) (79,488) (9,161)
Issue of Class B Non-Voting Shares, net of after-tax expenses 45,940 47,126 56,996
Purchase of Class B Non-Voting Shares for cancellation [note 12] –(118,150) (33,574)
Dividends paid on Class A Shares and Class B Non-Voting Shares (351,980) (372,088) (351,883)
Distributions paid to non-controlling interests (21,950) ––
482,865 50,316 36,965
Effect of currency translation on cash balances and cash flows – –58
Increase (decrease) in cash from continuing operations 374,642 (204,872) 453,237
Decrease in cash from discontinued operations [note 2] (147,950) (31,630) –
Increase (decrease) in cash 226,692 (236,502) 453,237
Cash, beginning of year 216,735 453,237 –
Cash, end of year 443,427 216,735 453,237
Cash includes cash, cash equivalents and short-term securities
See accompanying notes
79