Shaw 2011 Annual Report Download - page 116
Download and view the complete annual report
Please find page 116 of the 2011 Shaw annual report below. You can navigate through the pages in the report by either clicking on the pages listed below, or by using the keyword search tool below to find specific information within the annual report.-
 1
1 -
2
-
3
-
4
-
5
-
6
-
7
-
8
-
9
-
10
-
11
-
12
-
13
-
14
-
15
-
16
-
17
-
18
-
19
-
20
-
21
-
22
-
23
-
24
-
25
-
26
-
27
-
28
-
29
-
30
-
31
-
32
-
33
-
34
-
35
-
36
-
37
-
38
-
39
-
40
-
41
-
42
-
43
-
44
-
45
-
46
-
47
-
48
-
49
-
50
-
51
-
52
-
53
-
54
-
55
-
56
-
57
-
58
-
59
-
60
-
61
-
62
-
63
-
64
-
65
-
66
-
67
-
68
-
69
-
70
-
71
-
72
-
73
-
74
-
75
-
76
-
77
-
78
-
79
-
80
-
81
-
82
-
83
-
84
-
85
-
86
-
87
-
88
-
89
-
90
-
91
-
92
-
93
-
94
-
95
-
96
-
97
-
98
-
99
-
100
-
101
-
102
-
103
-
104
-
105
-
 106
106 -
 107
107 -
 108
108 -
 109
109 -
 110
110 -
 111
111 -
 112
112 -
 113
113 -
 114
114 -
 115
115 -
 116
116 -
 117
117 -
 118
118 -
 119
119 -
 120
120 -
 121
121 -
 122
122 -
 123
123 -
 124
124 -
 125
125 -
 126
126 -
127
-
128
-
129
-
130
-
131
-
132
-
133
-
134
-
135
-
136
-
137
-
138
-
139
-
140
-
141
-
142
-
143
-
144
-
145
-
146
-
147
-
148
-
149
 |
 |

Shaw Communications Inc.
NOTES TO CONSOLIDATED FINANCIAL STATEMENTS
August 31, 2011, 2010 and 2009
[all amounts in thousands of Canadian dollars except share and per share amounts]
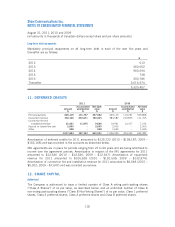
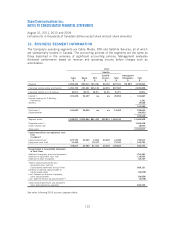
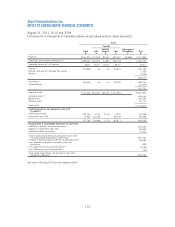
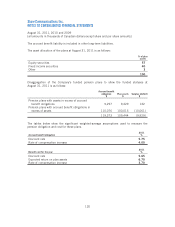
16. BUSINESS SEGMENT INFORMATION
The Company’s operating segments are Cable, Media, DTH and Satellite Services, all of which
are substantially located in Canada. The accounting policies of the segments are the same as
those described in the summary of significant accounting policies. Management evaluates
divisional performance based on revenue and operating income before charges such as
amortization.
2011
Satellite
Cable
$
Media
$
DTH
$
Satellite
Services
$
Total
$
Intersegment
Eliminations
$
Total
$
Revenue 3,095,456 890,913 745,350 82,181 827,531 (72,997) 4,740,903
Operating income before amortization 1,491,700 251,561 245,176 42,391 287,567 – 2,030,828
Operating income as % of revenue 48.2% 28.2% 32.9% 51.6% 34.7% – 42.8%
Interest(1) 231,678 53,237 n/a n/a 25,952 – 310,867
Burrard Landing Lot 2 Holdings
Partnership 1,291
Wireless 19,426
331,584
Cash taxes (2) 163,600 24,600 n/a n/a 51,400 – 239,600
Corporate/other (29,951)
209,649
Segment assets 7,249,671 2,830,944 861,424 502,810 1,364,234 – 11,444,849
Corporate assets (1) 1,065,028
Assets held for sale 16,000
Total assets 12,525,877
Capital expenditures and equipment costs
(net)
by segment
Capital expenditures 677,375 27,060 5,962 25,520 31,482 – 735,917
Equipment costs (net) 31,442 – 75,341 – 75,341 – 106,783
708,817 27,060 81,303 25,520 106,823 – 842,700
Reconciliation to Consolidated Statements
of Cash Flows
Additions to property, plant and equipment 704,461
Additions to equipment costs (net) 119,933
Additions to other intangibles 64,727
Total of capital expenditures and
equipment costs (net) per
Consolidated Statements of Cash Flows 889,121
Decrease in working capital related to
capital expenditures (16,679)
Less: Proceeds on disposal of property,
plant and equipment (26,826)
Less: Satellite services equipment profit (4) (2,916)
Total capital expenditures and equipment
costs (net) reported by segments 842,700
See notes following 2009 business segment table.
112