Shaw 2011 Annual Report Download - page 107
Download and view the complete annual report
Please find page 107 of the 2011 Shaw annual report below. You can navigate through the pages in the report by either clicking on the pages listed below, or by using the keyword search tool below to find specific information within the annual report.-
 1
1 -
2
-
3
-
4
-
5
-
6
-
7
-
8
-
9
-
10
-
11
-
12
-
13
-
14
-
15
-
16
-
17
-
18
-
19
-
20
-
21
-
22
-
23
-
24
-
25
-
26
-
27
-
28
-
29
-
30
-
31
-
32
-
33
-
34
-
35
-
36
-
37
-
38
-
39
-
40
-
41
-
42
-
43
-
44
-
45
-
46
-
47
-
48
-
49
-
50
-
51
-
52
-
53
-
54
-
55
-
56
-
57
-
58
-
59
-
60
-
61
-
62
-
63
-
64
-
65
-
66
-
67
-
68
-
69
-
70
-
71
-
72
-
73
-
74
-
75
-
76
-
77
-
78
-
79
-
80
-
81
-
82
-
83
-
84
-
85
-
86
-
87
-
88
-
89
-
90
-
91
-
92
-
93
-
94
-
95
-
96
-
 97
97 -
 98
98 -
 99
99 -
 100
100 -
 101
101 -
 102
102 -
 103
103 -
 104
104 -
 105
105 -
 106
106 -
 107
107 -
 108
108 -
 109
109 -
 110
110 -
 111
111 -
 112
112 -
 113
113 -
 114
114 -
 115
115 -
 116
116 -
 117
117 -
118
-
119
-
120
-
121
-
122
-
123
-
124
-
125
-
126
-
127
-
128
-
129
-
130
-
131
-
132
-
133
-
134
-
135
-
136
-
137
-
138
-
139
-
140
-
141
-
142
-
143
-
144
-
145
-
146
-
147
-
148
-
149
 |
 |
Shaw Communications Inc.
NOTES TO CONSOLIDATED FINANCIAL STATEMENTS
August 31, 2011, 2010 and 2009
[all amounts in thousands of Canadian dollars except share and per share amounts]
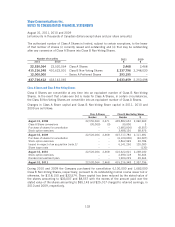
The authorized number of Class A Shares is limited, subject to certain exceptions, to the lesser
of that number of shares (i) currently issued and outstanding and (ii) that may be outstanding
after any conversion of Class A Shares into Class B Non-Voting Shares.
Number of securities 2011
$
2010
$2011 2010
22,520,064 22,520,064 Class A Shares 2,468 2,468
415,216,348 410,622,001 Class B Non-Voting Shares 2,337,796 2,248,030
12,000,000 – Series A Preferred Shares 293,195 –
437,736,412 433,142,065 2,633,459 2,250,498
Class A Shares and Class B Non-Voting Shares
Class A Shares are convertible at any time into an equivalent number of Class B Non-Voting
Shares. In the event that a take-over bid is made for Class A Shares, in certain circumstances,
the Class B Non-Voting Shares are convertible into an equivalent number of Class A Shares.
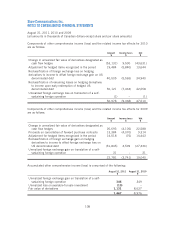
Changes in Class A Share capital and Class B Non-Voting Share capital in 2011, 2010 and
2009 are as follows:
Class A Shares Class B Non-Voting Shares
Number $ Number $
August 31, 2008 22,550,064 2,471 405,882,652 2,060,960
Class A Share conversions (30,000) (3) 30,000 3
Purchase of shares for cancellation – – (1,683,000) (8,557)
Stock option exercises – – 3,488,130 58,975
August 31, 2009 22,520,064 2,468 407,717,782 2,111,381
Purchase of shares for cancellation – – (6,100,000) (33,007)
Stock option exercises – – 2,862,969 49,786
Issued in respect of an acquisition [note 2] – – 6,141,250 120,000
Share issue costs – – – (130)
August 31, 2010 22,520,064 2,468 410,622,001 2,248,030
Stock option exercises – – 2,690,118 50,403
Dividend reinvestment plan – – 1,904,229 39,363
August 31, 2011 22,520,064 2,468 415,216,348 2,337,796
During 2010 and 2009 the Company purchased for cancellation 6,100,000 and 1,683,000
Class B Non-Voting Shares, respectively, pursuant to its outstanding normal course issuer bid or
otherwise, for $118,150 and $33,574. Share capital has been reduced by the stated value of
the shares amounting to $33,007 and $8,557 with the excess of the amount paid over the
stated value of the shares amounting to $85,143 and $25,017 charged to retained earnings, in
2010 and 2009, respectively.
103