Shaw 2011 Annual Report Download - page 130
Download and view the complete annual report
Please find page 130 of the 2011 Shaw annual report below. You can navigate through the pages in the report by either clicking on the pages listed below, or by using the keyword search tool below to find specific information within the annual report.-
 1
1 -
2
-
3
-
4
-
5
-
6
-
7
-
8
-
9
-
10
-
11
-
12
-
13
-
14
-
15
-
16
-
17
-
18
-
19
-
20
-
21
-
22
-
23
-
24
-
25
-
26
-
27
-
28
-
29
-
30
-
31
-
32
-
33
-
34
-
35
-
36
-
37
-
38
-
39
-
40
-
41
-
42
-
43
-
44
-
45
-
46
-
47
-
48
-
49
-
50
-
51
-
52
-
53
-
54
-
55
-
56
-
57
-
58
-
59
-
60
-
61
-
62
-
63
-
64
-
65
-
66
-
67
-
68
-
69
-
70
-
71
-
72
-
73
-
74
-
75
-
76
-
77
-
78
-
79
-
80
-
81
-
82
-
83
-
84
-
85
-
86
-
87
-
88
-
89
-
90
-
91
-
92
-
93
-
94
-
95
-
96
-
97
-
98
-
99
-
100
-
101
-
102
-
103
-
104
-
105
-
106
-
107
-
108
-
109
-
110
-
111
-
112
-
113
-
114
-
115
-
116
-
117
-
118
-
119
-
 120
120 -
 121
121 -
 122
122 -
 123
123 -
 124
124 -
 125
125 -
 126
126 -
 127
127 -
 128
128 -
 129
129 -
 130
130 -
 131
131 -
 132
132 -
 133
133 -
 134
134 -
 135
135 -
 136
136 -
 137
137 -
 138
138 -
 139
139 -
 140
140 -
141
-
142
-
143
-
144
-
145
-
146
-
147
-
148
-
149
 |
 |

Shaw Communications Inc.
NOTES TO CONSOLIDATED FINANCIAL STATEMENTS
August 31, 2011, 2010 and 2009
[all amounts in thousands of Canadian dollars except share and per share amounts]
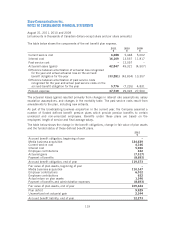
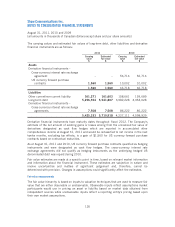
The carrying values and estimated fair values of long-term debt, other liabilities and derivative
financial instruments are as follows:
2011 2010
Carrying Estimated Carrying Estimated
value fair value value fair value
$$$$
Assets
Derivative financial instruments –
Cross-currency interest rate exchange
agreement – – 56,716 56,716
US currency forward purchase
contracts 1,560 1,560 10,002 10,002
1,560 1,560 66,718 66,718
Liabilities
Other current/non-current liability 161,271 161,603 158,661 159,689
Long-term debt 5,256,554 5,541,807 3,982,228 4,353,028
Derivative financial instruments –
Cross-currency interest rate exchange
agreements 7,508 7,508 86,222 86,222
5,425,333 5,710,918 4,227,111 4,598,939
Derivative financial instruments have maturity dates throughout fiscal 2012. The Company’s
estimate of the net amount of existing gains or losses arising from the unrealized fair value of
derivatives designated as cash flow hedges which are reported in accumulated other
comprehensive income at August 31, 2011 and would be reclassified to net income in the next
twelve months, excluding tax effects, is a gain of $1,560 for US currency forward purchase
contracts based on contractual maturities.
As at August 31, 2011 and 2010, US currency forward purchase contracts qualified as hedging
instruments and were designated as cash flow hedges. The cross-currency interest rate
exchange agreements did not qualify as hedging instruments as the underlying hedged US
denominated debt was repaid during 2010.
Fair value estimates are made at a specific point in time, based on relevant market information
and information about the financial instrument. These estimates are subjective in nature and
involve uncertainties and matters of significant judgement and, therefore, cannot be
determined with precision. Changes in assumptions could significantly affect the estimates.
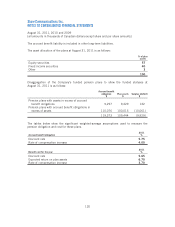
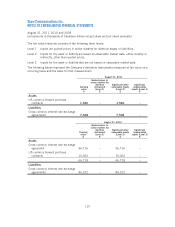
Fair value measurements
The fair value hierarchy is based on inputs to valuation techniques that are used to measure fair
value that are either observable or unobservable. Observable inputs reflect assumptions market
participants would use in pricing an asset or liability based on market data obtained from
independent sources while unobservable inputs reflect a reporting entity’s pricing based upon
their own market assumptions.
126