Shaw 2011 Annual Report Download - page 146
Download and view the complete annual report
Please find page 146 of the 2011 Shaw annual report below. You can navigate through the pages in the report by either clicking on the pages listed below, or by using the keyword search tool below to find specific information within the annual report.-
 1
1 -
2
-
3
-
4
-
5
-
6
-
7
-
8
-
9
-
10
-
11
-
12
-
13
-
14
-
15
-
16
-
17
-
18
-
19
-
20
-
21
-
22
-
23
-
24
-
25
-
26
-
27
-
28
-
29
-
30
-
31
-
32
-
33
-
34
-
35
-
36
-
37
-
38
-
39
-
40
-
41
-
42
-
43
-
44
-
45
-
46
-
47
-
48
-
49
-
50
-
51
-
52
-
53
-
54
-
55
-
56
-
57
-
58
-
59
-
60
-
61
-
62
-
63
-
64
-
65
-
66
-
67
-
68
-
69
-
70
-
71
-
72
-
73
-
74
-
75
-
76
-
77
-
78
-
79
-
80
-
81
-
82
-
83
-
84
-
85
-
86
-
87
-
88
-
89
-
90
-
91
-
92
-
93
-
94
-
95
-
96
-
97
-
98
-
99
-
100
-
101
-
102
-
103
-
104
-
105
-
106
-
107
-
108
-
109
-
110
-
111
-
112
-
113
-
114
-
115
-
116
-
117
-
118
-
119
-
120
-
121
-
122
-
123
-
124
-
125
-
126
-
127
-
128
-
129
-
130
-
131
-
132
-
133
-
134
-
135
-
 136
136 -
 137
137 -
 138
138 -
 139
139 -
 140
140 -
 141
141 -
 142
142 -
 143
143 -
 144
144 -
 145
145 -
 146
146 -
 147
147 -
 148
148 -
 149
149
 |
 |

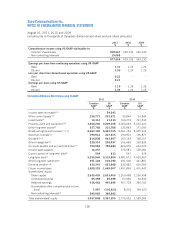
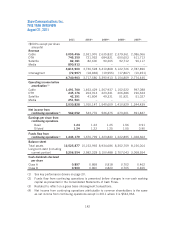
Shaw Communications Inc.
FIVE YEAR IN REVIEW
August 31, 2011
2011 2010(3) 2009(3) 2008(3) 2007(3)
($000’s except per share
amounts)
Revenue
Cable 3,095,456 2,931,976 2,635,832 2,379,361 2,086,066
DTH 745,350 721,952 684,831 650,653 611,713
Satellite 82,181 82,600 90,205 92,712 90,117
Media 890,913 ––– –
4,813,900 3,736,528 3,410,868 3,122,726 2,787,896
Intersegment (72,997) (18,948) (19,955) (17,867) (13,451)
4,740,903 3,717,580 3,390,913 3,104,859 2,774,445
Operating income before
amortization(1)
Cable 1,491,700 1,453,429 1,267,937 1,152,522 997,088
DTH 245,176 264,914 223,341 206,486 196,324
Satellite 42,391 41,804 49,331 51,921 51,027
Media 251,561 ––– –
2,030,828 1,760,147 1,540,609 1,410,929 1,244,439
Net income from
continuing operations(4) 562,052 533,776 536,475 673,201 391,837
Earnings per share from
continuing operations
Basic 1.24 1.23 1.25 1.56 0.91
Diluted 1.24 1.23 1.25 1.55 0.90
Funds flow from
continuing operations(2) 1,443,179 1,376,799 1,323,840 1,222,895 1,028,363
Balance sheet
Total assets 12,525,877 10,153,965 8,934,686 8,352,759 8,156,004
Long-term debt (including
current portion) 5,256,554 3,982,228 3,150,488 2,707,043 3,068,554
Cash dividends declared
per share
Class A 0.897 0.858 0.818 0.702 0.462
Class B 0.900 0.860 0.820 0.705 0.465
(1) See key performance drivers on page 20.
(2) Funds flow from continuing operations is presented before changes in non-cash working
capital as presented in the Consolidated Statements of Cash Flows.
(3) Restated to reflect on a gross basis intersegment transactions.
(4) Net income from continuing operations attributable to common shareholders is the same
as net income from continuing operations except in 2011 where it is $542,964.
142