Shaw 2011 Annual Report Download - page 62
Download and view the complete annual report
Please find page 62 of the 2011 Shaw annual report below. You can navigate through the pages in the report by either clicking on the pages listed below, or by using the keyword search tool below to find specific information within the annual report.-
 1
1 -
2
-
3
-
4
-
5
-
6
-
7
-
8
-
9
-
10
-
11
-
12
-
13
-
14
-
15
-
16
-
17
-
18
-
19
-
20
-
21
-
22
-
23
-
24
-
25
-
26
-
27
-
28
-
29
-
30
-
31
-
32
-
33
-
34
-
35
-
36
-
37
-
38
-
39
-
40
-
41
-
42
-
43
-
44
-
45
-
46
-
47
-
48
-
49
-
50
-
51
-
 52
52 -
 53
53 -
 54
54 -
 55
55 -
 56
56 -
 57
57 -
 58
58 -
 59
59 -
 60
60 -
 61
61 -
 62
62 -
 63
63 -
 64
64 -
 65
65 -
 66
66 -
 67
67 -
 68
68 -
 69
69 -
 70
70 -
 71
71 -
 72
72 -
73
-
74
-
75
-
76
-
77
-
78
-
79
-
80
-
81
-
82
-
83
-
84
-
85
-
86
-
87
-
88
-
89
-
90
-
91
-
92
-
93
-
94
-
95
-
96
-
97
-
98
-
99
-
100
-
101
-
102
-
103
-
104
-
105
-
106
-
107
-
108
-
109
-
110
-
111
-
112
-
113
-
114
-
115
-
116
-
117
-
118
-
119
-
120
-
121
-
122
-
123
-
124
-
125
-
126
-
127
-
128
-
129
-
130
-
131
-
132
-
133
-
134
-
135
-
136
-
137
-
138
-
139
-
140
-
141
-
142
-
143
-
144
-
145
-
146
-
147
-
148
-
149
 |
 |

Shaw Communications Inc.
MANAGEMENT’S DISCUSSION AND ANALYSIS
August 31, 2011
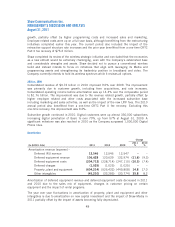
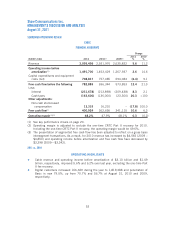
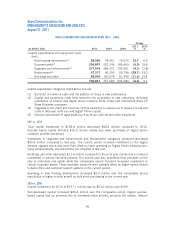
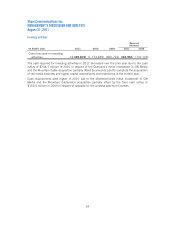
SATELLITE (DTH and Satellite Services)
FINANCIAL HIGHLIGHTS
Change
($000’s Cdn) 2011 2010(4) 2009(4)
2011
%
2010
%
DTH (Shaw Direct) 745,350 721,952 684,831 3.2 5.4
Satellite Services 82,181 82,600 90,205 (0.5) (8.4)
Revenue 827,531 804,552 775,036 2.9 3.8
Operating income before amortization(1)
DTH (Shaw Direct) 245,176 264,914 223,341 (7.5) 18.6
Satellite Services 42,391 41,804 49,331 1.4 (15.3)
287,567 306,718 272,672 (6.2) 12.5
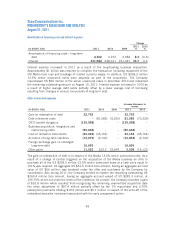
Capital expenditures and equipment costs
(net):
Success-based 75,927 77,684 73,453 (2.3) 5.8
Transponders 24,500 ––100.0 –
Buildings and other 6,396 7,927 8,008 (19.3) (1.0)
106,823 85,611 81,461 24.8 (5.1)
Free cash flow before the following 180,744 221,107 191,211 (18.3) 15.6
Less:
Interest (2) (25,952) (26,251) (26,251) (1.1) –
Cash taxes on net income (51,400) (44,000) – 16.8 100.0
Other adjustments:
Non-cash stock-based compensation 1,370 1,628 – (15.8) 100.0
Free cash flow(1) 104,762 152,484 164,960 (31.3) (7.6)
Operating margin(3) 34.7% 34.8% 35.2% (0.1) (0.4)
(1) See key performance drivers on page 20.
(2) Interest is allocated to the Satellite division based on the actual cost of debt incurred by
the Company to repay prior outstanding Satellite debt and to fund accumulated cash
deficits of Satellite Services and Shaw Direct.
(3) Operating margin is adjusted to exclude the one-time CRTC Part II fee recovery in 2010.
Including the one-time CRTC Part II recovery, operating margin would be 38.1%.
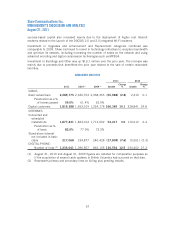
(4) The presentation of segmented free cash flow has been adjusted to reflect on a gross basis
intersegment transactions. As a result, for 2010 revenue has increased by $14,383 (2009
– $15,105) and operating income before amortization and free cash flow have increased by
$3,398 (2009 – $3,342).
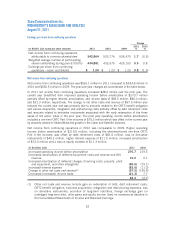
SUBSCRIBER STATISTICS
2011 2010 2009
Shaw Direct customers (1) 908,883 905,796 900,941
(1) Including seasonal customers who temporarily suspend their service.
58