Shaw 2011 Annual Report Download - page 102
Download and view the complete annual report
Please find page 102 of the 2011 Shaw annual report below. You can navigate through the pages in the report by either clicking on the pages listed below, or by using the keyword search tool below to find specific information within the annual report.-
 1
1 -
2
-
3
-
4
-
5
-
6
-
7
-
8
-
9
-
10
-
11
-
12
-
13
-
14
-
15
-
16
-
17
-
18
-
19
-
20
-
21
-
22
-
23
-
24
-
25
-
26
-
27
-
28
-
29
-
30
-
31
-
32
-
33
-
34
-
35
-
36
-
37
-
38
-
39
-
40
-
41
-
42
-
43
-
44
-
45
-
46
-
47
-
48
-
49
-
50
-
51
-
52
-
53
-
54
-
55
-
56
-
57
-
58
-
59
-
60
-
61
-
62
-
63
-
64
-
65
-
66
-
67
-
68
-
69
-
70
-
71
-
72
-
73
-
74
-
75
-
76
-
77
-
78
-
79
-
80
-
81
-
82
-
83
-
84
-
85
-
86
-
87
-
88
-
89
-
90
-
91
-
 92
92 -
 93
93 -
 94
94 -
 95
95 -
 96
96 -
 97
97 -
 98
98 -
 99
99 -
 100
100 -
 101
101 -
 102
102 -
 103
103 -
 104
104 -
 105
105 -
 106
106 -
 107
107 -
 108
108 -
 109
109 -
 110
110 -
 111
111 -
 112
112 -
113
-
114
-
115
-
116
-
117
-
118
-
119
-
120
-
121
-
122
-
123
-
124
-
125
-
126
-
127
-
128
-
129
-
130
-
131
-
132
-
133
-
134
-
135
-
136
-
137
-
138
-
139
-
140
-
141
-
142
-
143
-
144
-
145
-
146
-
147
-
148
-
149
 |
 |

Shaw Communications Inc.
NOTES TO CONSOLIDATED FINANCIAL STATEMENTS
August 31, 2011, 2010 and 2009
[all amounts in thousands of Canadian dollars except share and per share amounts]
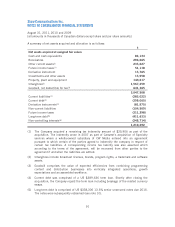
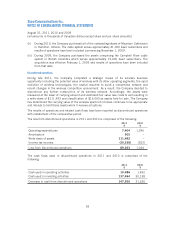
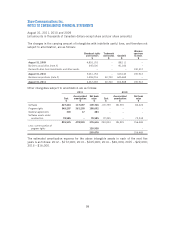
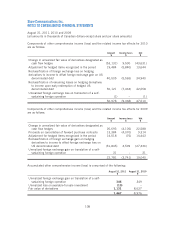
The changes in the carrying amount of intangibles with indefinite useful lives, and therefore not
subject to amortization, are as follows:
Broadcast rights
and licenses
Trademark
and brands Goodwill
Wireless
spectrum
licenses
$$$$
August 31, 2009 4,816,153 – 88,111 –
Business acquisition [note 2] 245,000 – 81,032 –
Reclassification from Investments and other assets – – – 190,912
August 31, 2010 5,061,153 – 169,143 190,912
Business acquisitions [note 2] 1,406,216 40,700 645,665 –
August 31, 2011 6,467,369 40,700 814,808 190,912
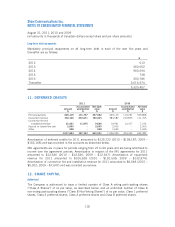
Other intangibles subject to amortization are as follows:
2011 2010
Cost
$
Accumulated
amortization
$
Net book
value
$
Cost
$
Accumulated
amortization
$
Net book
value
$
Software 227,443 117,697 109,746 170,759 86,535 84,224
Program rights 549,207 361,205 188,002 –– –
Material agreements 300 17 283 –– –
Software assets under
construction 78,585 – 78,585 72,245 – 72,245
855,535 478,919 376,616 243,004 86,535 156,469
Less: current portion of
program rights 120,938 –
255,678 156,469
The estimated amortization expense for the above intangible assets in each of the next five
years is as follows: 2012 – $172,000; 2013 – $105,000; 2014 – $40,000; 2015 – $22,000;
2016 – $16,000.
98