Shaw 2011 Annual Report Download - page 60
Download and view the complete annual report
Please find page 60 of the 2011 Shaw annual report below. You can navigate through the pages in the report by either clicking on the pages listed below, or by using the keyword search tool below to find specific information within the annual report.-
 1
1 -
2
-
3
-
4
-
5
-
6
-
7
-
8
-
9
-
10
-
11
-
12
-
13
-
14
-
15
-
16
-
17
-
18
-
19
-
20
-
21
-
22
-
23
-
24
-
25
-
26
-
27
-
28
-
29
-
30
-
31
-
32
-
33
-
34
-
35
-
36
-
37
-
38
-
39
-
40
-
41
-
42
-
43
-
44
-
45
-
46
-
47
-
48
-
49
-
 50
50 -
 51
51 -
 52
52 -
 53
53 -
 54
54 -
 55
55 -
 56
56 -
 57
57 -
 58
58 -
 59
59 -
 60
60 -
 61
61 -
 62
62 -
 63
63 -
 64
64 -
 65
65 -
 66
66 -
 67
67 -
 68
68 -
 69
69 -
 70
70 -
71
-
72
-
73
-
74
-
75
-
76
-
77
-
78
-
79
-
80
-
81
-
82
-
83
-
84
-
85
-
86
-
87
-
88
-
89
-
90
-
91
-
92
-
93
-
94
-
95
-
96
-
97
-
98
-
99
-
100
-
101
-
102
-
103
-
104
-
105
-
106
-
107
-
108
-
109
-
110
-
111
-
112
-
113
-
114
-
115
-
116
-
117
-
118
-
119
-
120
-
121
-
122
-
123
-
124
-
125
-
126
-
127
-
128
-
129
-
130
-
131
-
132
-
133
-
134
-
135
-
136
-
137
-
138
-
139
-
140
-
141
-
142
-
143
-
144
-
145
-
146
-
147
-
148
-
149
 |
 |

Shaw Communications Inc.
MANAGEMENT’S DISCUSSION AND ANALYSIS
August 31, 2011
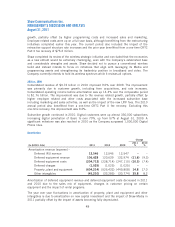
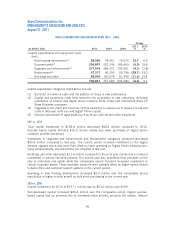
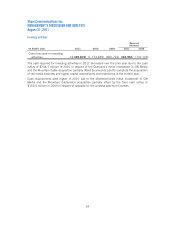
CAPITAL EXPENDITURES AND EQUIPMENT COSTS (NET) – CABLE
Change
(In $000’s Cdn) 2011 2010 2009
2011
%
2010
%
Capital expenditures and equipment costs
(net):
New housing development(1) 88,066 78,451 73,676 12.3 6.5
Success-based(2) 206,897 222,246 185,469 (6.9) 19.8
Upgrades and enhancement(3) 277,543 289,421 297,651 (4.1) (2.8)
Replacement(4) 47,371 66,393 55,798 (28.7) 19.0
Buildings and other 88,940 100,574 81,490 (11.6) 23.4
708,817 757,085 694,084 (6.4) 9.1
Capital expenditure categories listed above include:
(1) Build out of mainline cable and the addition of drops in new subdivisions.
(2) Capital and equipment costs (net) related to the acquisition of new customers, including
installation of internet and digital phone modems, DCTs, filters and commercial drops for
Shaw Business customers.
(3) Upgrades to the plant and build out of fibre backbone to reduce use of leased circuits and
costs to decrease node size and Digital Phone capital.
(4) Normal replacement of aged assets such as drops, vehicles and other equipment.
2011 vs. 2010
Total capital investment of $708.8 million decreased $48.3 million compared to 2010.
Success based capital declined $15.3 million mainly due lower purchases of digital phone
customer premise equipment.
Investment in Upgrades and enhancement and Replacement categories combined decreased
$30.9 million compared to last year. The current period included investment in the digital
network upgrade which was more than offset by lower spending on Digital Phone infrastructure,
Video enhancements, and automotive as compared to last year.
Buildings and other decreased $11.6 million compared to the prior year mainly due to reduced
investment in various facilities projects. The current year also benefitted from proceeds on the
sale of redundant real estate while the comparable period included increased investment in
certain corporate assets. These favorable variances were partially offset by higher spend related
to back office and customer support systems in the current period.
Spending in new housing development increased $9.6 million over the comparable period
mainly due to higher activity as well as bulk stock purchasing in the current year.
2010 vs. 2009
Capital investment for 2010 of $757.1 million was up $63.0 million over 2009.
Success-based capital increased $36.8 million over the comparable period. Digital success-
based capital was up primarily due to increased rental activity, primarily HD rentals. Internet
56